

Release Date :
Reference Number :
SR-2025-002
Headline Inflation
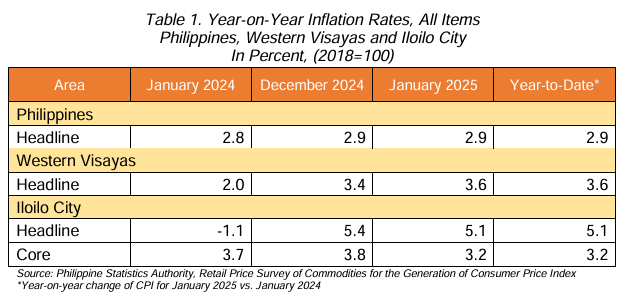
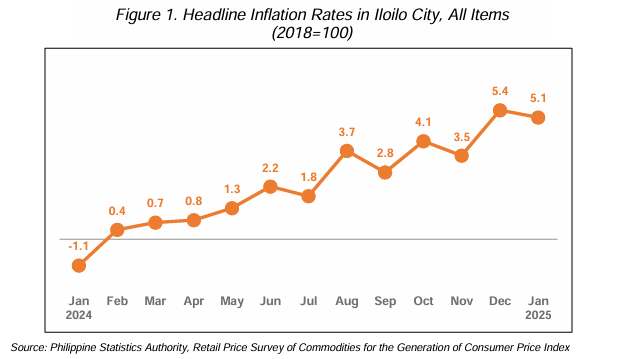
The headline inflation in Iloilo City slowed down to 5.1 percent in January 2025 from 5.4 percent in December 2024. Meanwhile, it accelerated from the -1.1 percent inflation rate in the same month of the previous year.
Moreover, the headline inflation rate of Iloilo City was higher than the regional inflation rate of Western Visayas which was at 3.6 percent, and the country’s 2.9 percent in January 2025.
Main Drivers to the Downtrend of the Headline Inflation
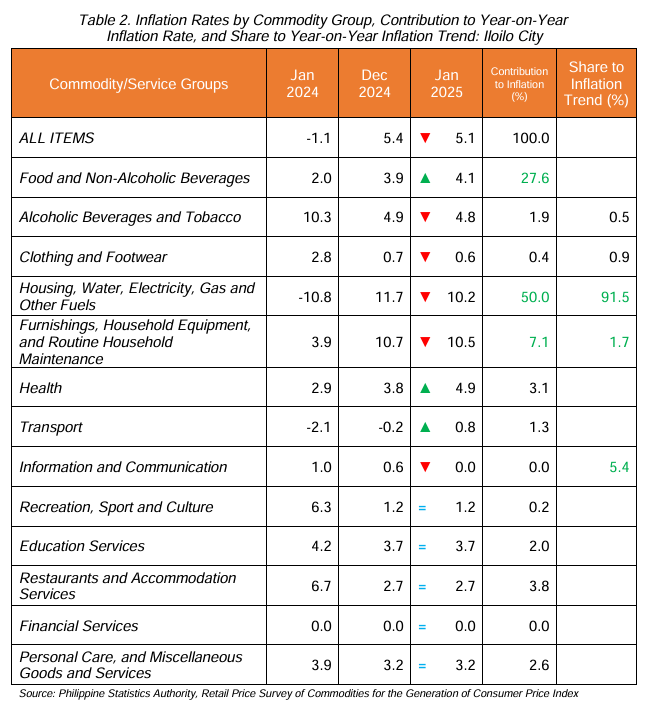
The decline in the headline inflation of Iloilo City in January 2025 was largely affected by the slower year-on-year increase in prices of Housing, Water, Electricity, Gas and Other Fuels with a current inflation rate of 10.2 percent from 11.7 percent in the December 2024. Information and Communication also contributed with a 0.0 percent inflation rate, down from 0.6 percent. Furnishings, Household Equipment, and Routine Household Maintenance also decelerated from 10.7 percent to 10.5 percent. Other contributor were Clothing and Footwear (0.6 percent from 0.7 percent), and Alcoholic Beverages and Tobacco (4.8 percent from 4.9 percent).
On the other hand, faster year-on-year price increases were experienced in the following commodity groups:
a. Food and Non-Alcoholic Beverages, 4.1 percent from 3.9 percent;
b. Health, 4.9 percent from 3.8 percent; and
c. Transport, 0.8 percent from -0.2 percent.
Meanwhile, the following commodity groups had no changes in their inflation rates from the previous month:
a. Recreation, Sport and Culture, 1.2 percent;
b. Education Services, 3.7 percent;
c. Restaurants and Accommodation Services, 2.7 percent;
d. Financial Services, 0.0 percent and
e. Personal Care, and Miscellaneous Goods and Services, 3.2 percent
Main Contributors to the Headline Inflation
The top three commodity groups that contributed to the January 2025 headline inflation in Iloilo City were the following:
a. Housing, Water, Electricity, Gas and Other Fuels, 50.0 percent share or 2.6 percentage points;
b. Food and Non-Alcoholic Beverages, 27.6 percent share or 1.4 percentage points; and
c. Furnishings, Household Equipment, and Routine Household Maintenance, 7.1 percent share or 0.4 percentage points.
Food Inflation
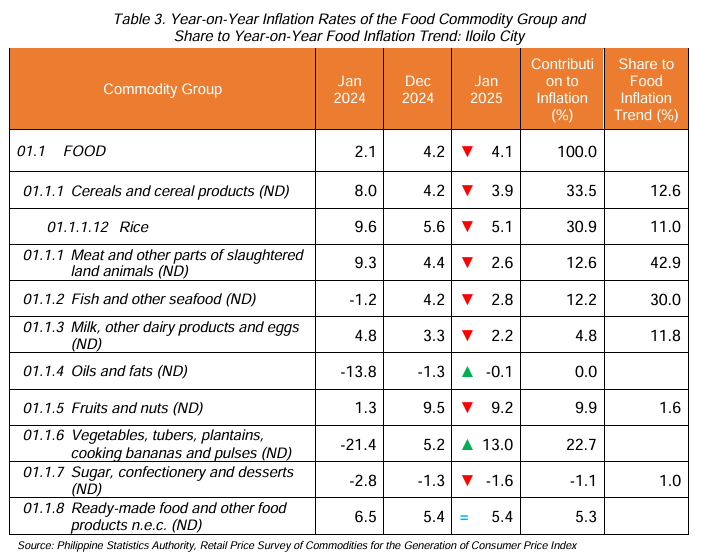
Iloilo City’s food inflation in January 2025 decreased to 4.1 percent from 4.2 percent in the previous month. However, it was higher than the 2.1 percent food inflation in the city in January 2024.
Main Drivers to the Downtrend of the Food Inflation
The decline in the January 2025 food inflation in Iloilo City was primarily affected by the slower year-on-year price increments of Meat and other parts of slaughtered land animals with an inflation rate of 2.6 percent from 4.4 percent in the previous month. Another contributor was Fish and other seafood also contributed which decreased to 2.8 percent from 4.2 percent. Cereals and cereal products also decelerated to 3.9 percent from 4.2 percent. Other contributors to the decrease were Milk, other dairy products and eggs (2.2 percent from 3.3 percent), Fruits and nuts (9.2 percent from 9.5 percent) and Sugar, confectionery and desserts (-1.6 percent from -1.3 percent).
Conversely, faster annual increase in prices was observed in Vegetables, tubers, plantains, cooking bananas and pulses which increased from 13.0 percent from 5.2 percent. Oils and fats, on the other hand, experienced slower deflation which went up to -0.1 percent from -1.3 percent.
Lastly, Ready-made food and other food products retained its inflation rate from the previous month which was at 5.4 percent.
Main Contributors to the Food Inflation
The top three food groups with the biggest share to the January 2025 food inflation in the City were the following:
a. Cereals and cereal products, 33.5 percent share or 1.4 percentage points.
b. Vegetables, tubers, plantains, cooking bananas and pulses, 22.7 percent share or 0.9 percentage points.
c. Meat and other parts of slaughtered land animals, 12.6 percent share or 0.5 percentage points.
Core Inflation
Core inflation, which excludes selected food and energy items, had slower annual increments in January 2025 with 3.2 percent inflation compared to December 2024’s 3.8 percent. Further, it was lower than the 3.7 core inflation rate in January 2024.
Originally Signed
JERRY L. DOLUTAN
(Supervising Statistical Specialist)
Officer-in-Charge
PSA RSSO VI - Iloilo