REGISTERED MARRIAGES IN CAPIZ RECORDED AT 651
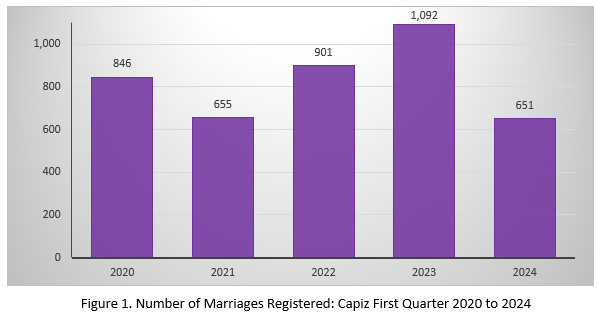
The number of marriages registered in Capiz during the first quarter of 2024 with 651 marriages marked significant decline compared to previous years. The record showed that it was the lowest among the years 2020 to 2024. The highest number of marriages registered was in 2023, with 1,092 marriages recorded. This year's figures represent a substantial decrease of 40.4 percent, indicating a notable downturn in the number of couples choosing to tie the knot in Capiz during the first three months of 2024 (Figure 1).

NUMBER OF MARRIAGES AND PLACE OF OCCURRENCE
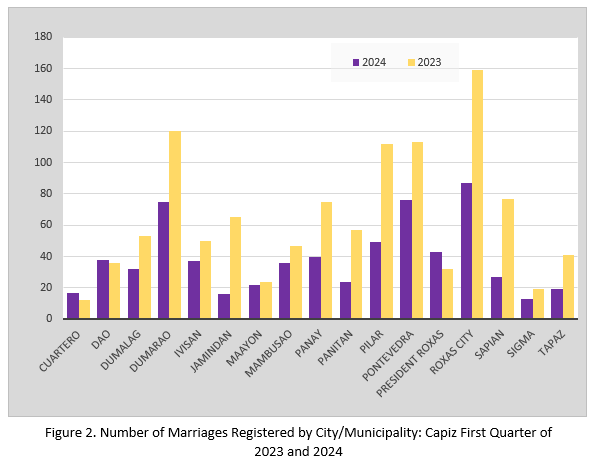
As shown in Figure 2 and Table 1, the total number of marriages registered in the province during the first quarter of 2024 was 651. This represents a significant decrease of 40.4 percent compared to the 1,092 marriages recorded in the same period of 2023. On average, approximately seven couples were wed each day in 2024, down from twelve couples per day in 2023.

As expected, Roxas City accounted for the highest number of marriages, with 87 or 13.4 percent of the total. This represents a significant decrease of 45.3 percent compared to the same period in 2023. The municipalities of Pontevedra and Dumarao followed closely behind, with 76 and 75 marriages respectively, accounting for 11.7 percent and 11.5 percent of the total. Sigma had the lowest number of marriages with only 13 registrations, representing a mere 2.0 percent share of the total registered marriages in the province. Of the sixteen municipalities and sole city in Capiz, nearly all exhibited a decline in registered marriages during the first quarter of 2024 compared to the first quarter of 2023.
Only the municipalities of Cuartero, President Roxas, and Dao experienced increases, with Cuartero showing the most significant growth at 41.7 percent. In contrast, Jamindan recorded the highest decline in registered marriages, with a decrease of 75.4 percent (Table 1).

MONTH OF THE HIGHEST REGISTERED MARRIAGE OCCURRENCE
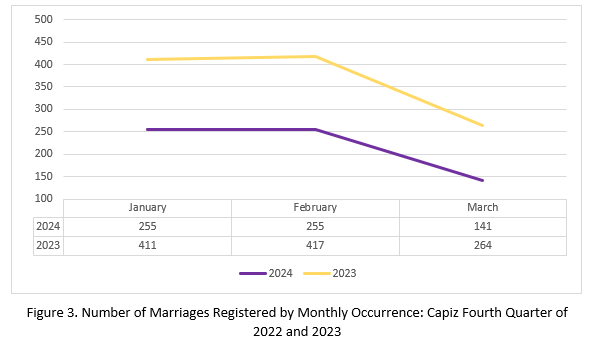
Figure 3 below illustrates the monthly distribution of marriages. January and February were the busiest months, with 255 registered marriages each. This translates to a daily average of 8.2 and 8.8 marriages, respectively.

March had the lowest number of registered marriages in the first quarter of 2024, with only 141. This translates to a daily average of 4.5, or approximately 5 marriages per day during the month.


