

Release Date :
Reference Number :
SR2025-0604-06
Year-on-Year Inflation
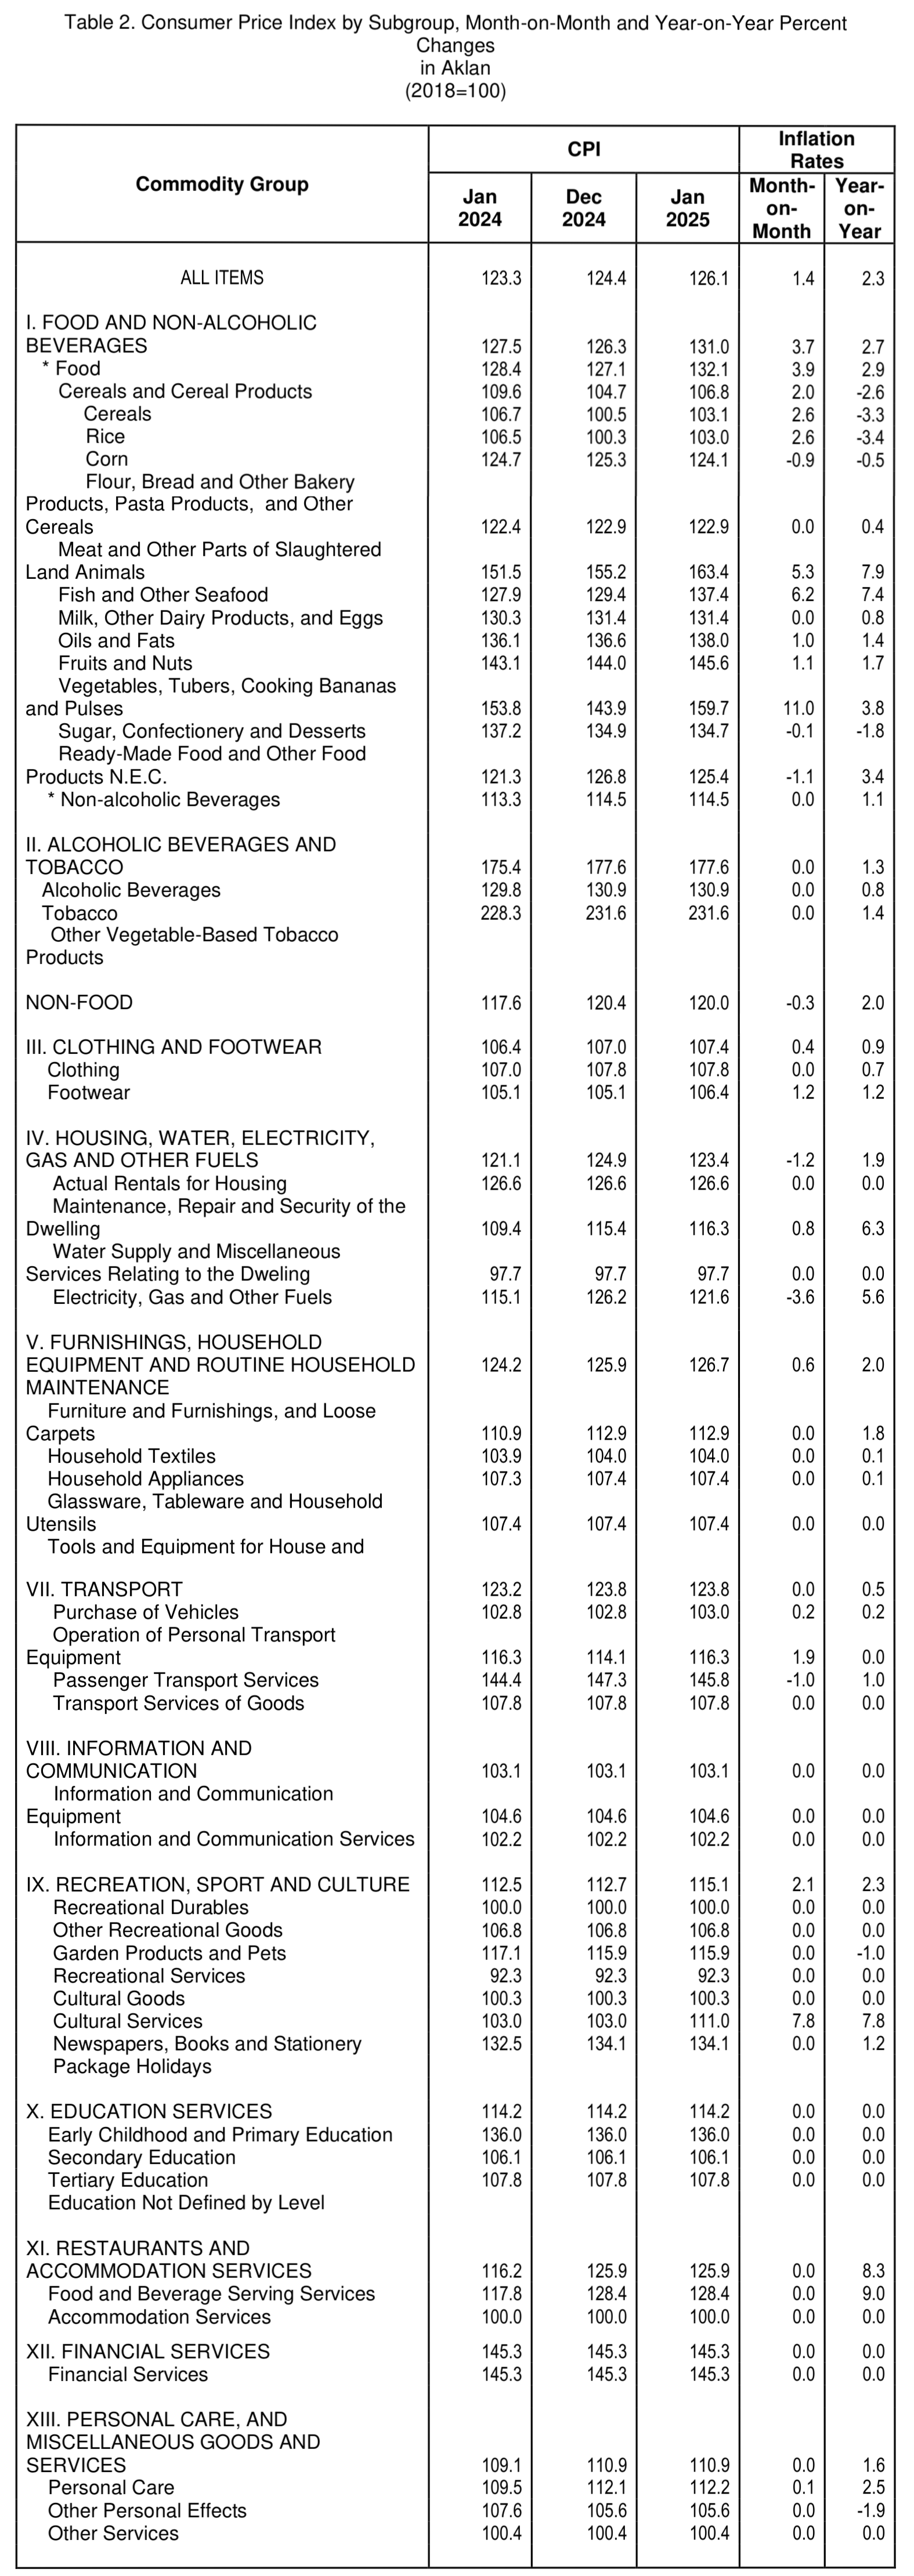
In January 2025, the headline inflation in Aklan grew at a faster rate of 2.3 percent compared to the 1.4 percent recorded in the previous month, but is lower by 0.7 percentage points from the 3.0 percent inflation observed in January 2024. Aklan's inflation rate fall below the national and regional rate, standing at 2.9 percent and 3.6 percent, respectively. However, the provincial inflation showed faster increase from December 2024 to January 2025 inflation compared to the national and regional level.

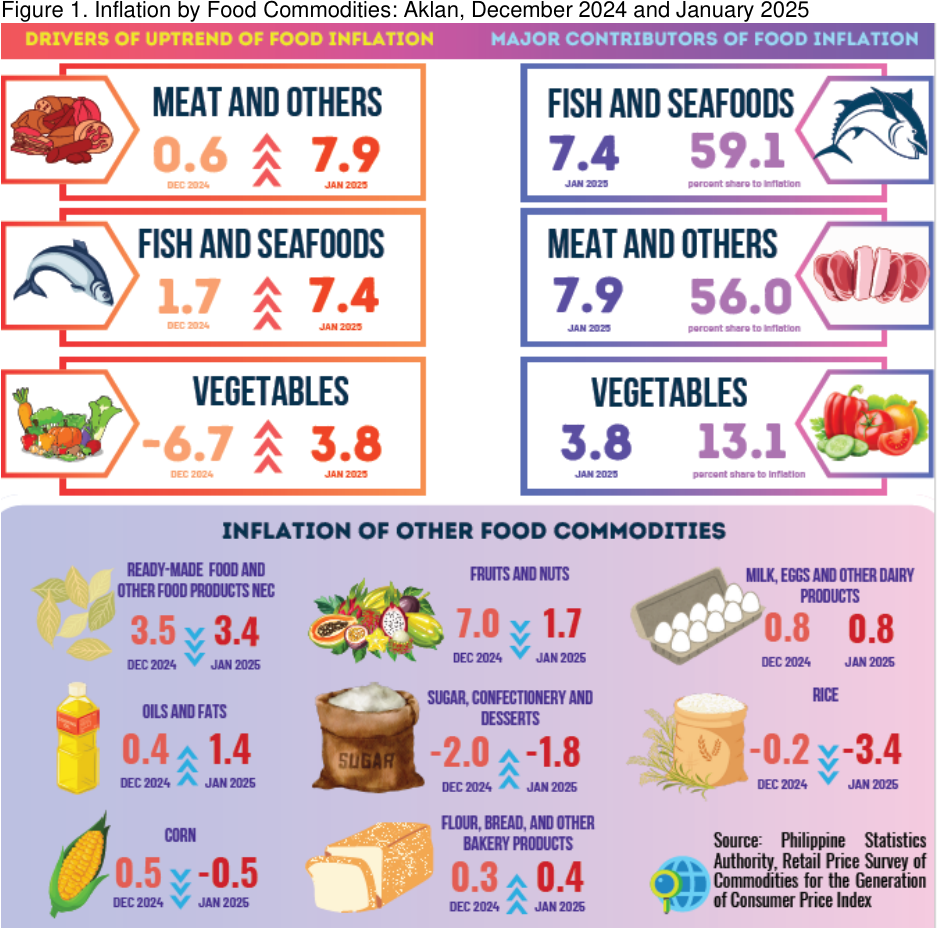
Among the major commodity groups, the primary factor contributing to the uptrend in inflation this month was Food and Non-alcoholic beverages, registering an inflation of 2.7 percent from 0.2 percent inflation in the previous month. It was observed that prices of Meat, like pork and chicken,mainly brought the uptrend of Food and Non-alcoholic Beverages, showing 7.9 percent inflationin January 2025 from 0.6 percent inflation in December 2024. (See Figure 1)
Among other food commodities, Fish and seafoods, followed next, this month from 1.7 percent to7.4 percent during the reference month, as well as, Vegetables, tubers, plantains, cooking bananas and pulses which increased from –6.7 percent to 3.8 percent. Oils and fats went up from 0.4 percent to 1.4 percent and Sugar, confectionery and desserts went up from -2.0 percent in December 2024 to -1.8 percent in January 2025 (See Figure 1)
On the contrary, price of other food products increased slower from December 2024 to January 2025:
a. Rice, from -0.2 percent to -3.4 percent;
b. Corn, from 0.5 percent to -0.5 percent;
c. Fruits and Nuts, from 7.0 percent to 1.7 percent; and
d. Ready-made food and other food products nec, from 3.5 percent to 3.4 percent. (See
Figure 1)
Following the Food and Non-Alcoholic Beverages, Recreation, Sport and Culture commodities displayed an acceleration in inflation from 0.2 percent in the previous month to 2.3 percent in January 2025, while, Furnishings, household equipment and routine household maintenance inflated from 1.4 percent a month ago to 2.0 percent reported this month. Moreover, Transport (0.5 percent) and Clothing and Footwear (0.9 percent) showed increase in inflation from December 2024 to January 2025. On the other hand, 1. Housing, water, electricity, gas and other fuels slowed down from 2.9 percent to 1.9 percent, as well as, Personal care, and miscellaneous goods and services went down from 1.7 percent to 1.6 percent. (See Figure 2) Figure 2. Inflation by Major Commodities, except, Food and Non-Alcoholic Beverages: Aklan, December 2024 and January 2025
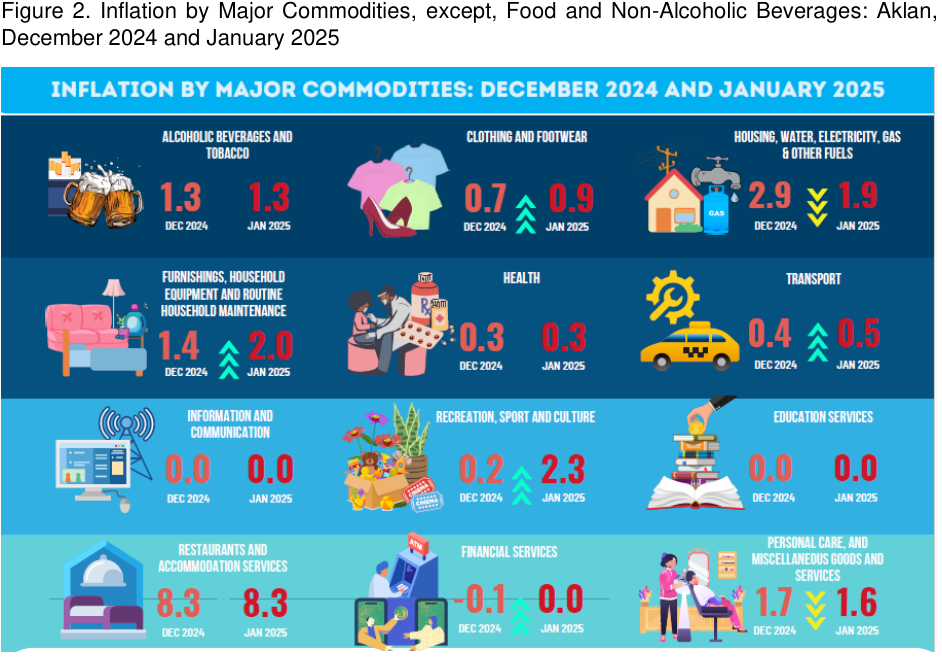
On the other hand, the following commodity groups have static inflation movement in January 2025 from December 2024:
1. Alcoholic beverages and tobacco, 1.3 percent;
2. Health, 0.3 percent; and
3. Restaurants and accommodation services, 8.3 percent. (See Figure 2)
While, the rest of the major commodity groups showed zero inflation in January 2025. (See Figure 2)
Major Contributors to Inflation
The overall inflation of Aklan was mainly contributed by price hike of Food and non-alcoholic beverages which recorded 2.7 percent inflation with 48.7 percent share to overall inflation. This was followed by Restaurants and accommodation services at 8.3 percent inflation with 21.8 percent share to inflation, and Housing, water, electricity, gas and other fuels with 1.9 percent inflation and 16.0 percent share to inflation.
Other major commodity groups also contributed to the province’s inflation rate in January 2025:
a. Personal care and Miscellaneous goods and services, 1.6 percent inflation with 3.2 percent share;
b. Furnishings, Household Equipment and Routine Household Maintenance, 2.0 percent inflation with 3.2 percent share;
c. Transport, 0.5 percent with 2.0 percent share;
d. Alcoholic beverages and tobacco, 1.3 percent with 1.6 percent share;
e. Clothing and footwear, 0.9 percent inflation with 1.5 percent share, and
f. Recreation, sport and culture, 2.3 percent inflation with 1.4 percent share to inflation.
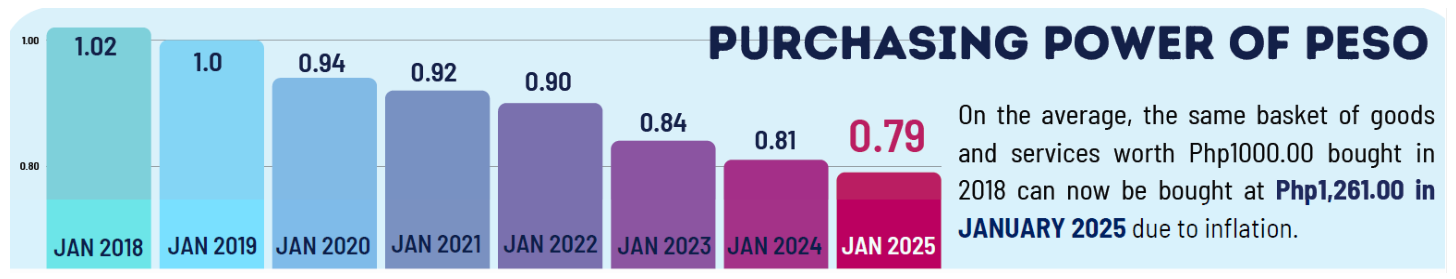
Purchasing Power of Peso
EXPLANATORY TEXT
Consumer Price Index (CPI) - is an indicator of the change in the average retail prices of a fixed basket of goods and services commonly purchased by the households relative to a base year. It shows how much on the average, prices of goods and services have increased or
decreased from a particular reference period.
The CPI Report was derived from the results of the 2018-based CPI survey comprised of thirteen (13) major commodity groups. These are the following: Food and Non-alcoholic Beverages; Alcoholic Beverages and Tobacco; Clothing and Footwear; Housing, Water, Electricity, Gas and Other Fuels; Furnishings, Household Equipment and Routine Maintenance of the House; Health; Transport; Information and Communication Services; Recreation, Sport and Culture; ducation; Restaurants and Accommodation Services; Financial Services; and Personal Care and iscellaneous Goods and Services.
Inflation rate is defined as the annual rate of change or the year-on-year change in the CPI.
Purchasing power of peso is a measure of the real value of the peso in a given period relative to a chosen reference period.
Market basket is a term used to refer to a sample of goods and services that are commonly purchased and bought by an average Filipino household.
Base period or Base Year is the period, usually a year, at which the index number is set to 100. It is the reference point of the index number series. In this report, 2018 is used as the base period.
ENGR. ANTONET B. CATUBUAN
Chief Statistical Specialist