

Release Date :
Reference Number :
PR-202408-0645-49
Table 1. Year-on-Year Inflation Rate for All Income Households, All Items
(2018=100) in percent
Area | July 2023 | June 2024 | July 2024 | Year-to-Date |
Philippines | 4.7 | 3.7 | 4.4 | 3.7 |
Western Visayas | 5.8 | 4.9 | 4.8 | 3.7 |
Negros Occidental | 7.6 | 4.5 | 4.8 | 3.5 |
Bacolod City | 6.6 | 6.1 | 6.2 | 4.2 |
Source: Philippine Statistics Authority, Retail Price Survey of Commodities for the Generation of Consumer Price Index
*Year-on-year change of CPI for January to July 2024 vs. 2023
Figure 2. Inflation Rate in Negros Occidental for July 2024, All Items
(2018=100) in percent
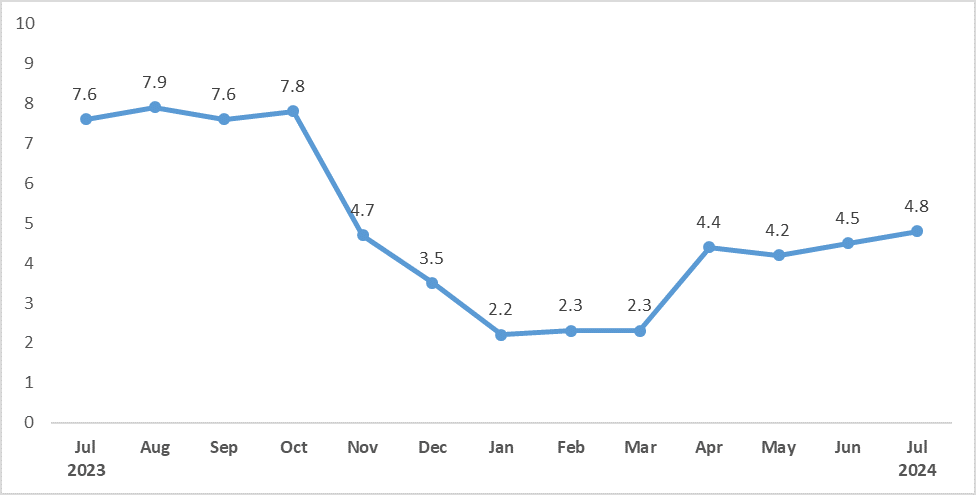
Source: Philippine Statistics Authority, Retail Price Survey of Commodities for the Generation of Consumer Price Index
Negros Occidental’s Inflation Rate for all income household July 2024 shows an increase to 4.8 percent from 4.5 percent in last month’s report and decline against July 2023 with 7.6 percent (Please see Figure 1). Some commodities noted to have a positive annual growth like; Food & Non-Alcoholic Beverages, Clothing and Footwear, Housing/Water/Electricity/Gas and Other Fuels, Transport and Education Services. While Alcoholic Beverages & Tobacco, and Recreation/Sports & Culture recorded a negative inflation.
Figure 2. Inflation Rate in Bacolod City for July 2024, All Items
(2018=100) in percent
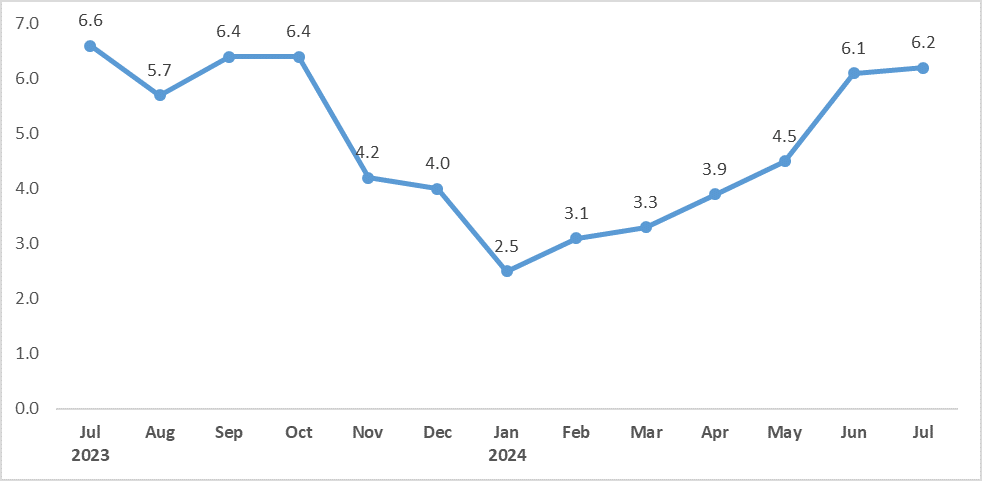
Source: Philippine Statistics Authority, Retail Price Survey of Commodities for the Generation of Consumer Price Index
In Bacolod City, Inflation Rate for All Income Households also exhibited an increase at 6.2 percent from 6.1 percent in June 2024 and decrease against July 2023 at 6.6 percent. (See Figure 2).
The rise up was attributed by a slight increase in the indices of some commodities like; Clothing & Footwear at 12.3 percent from 12.2 percent in June 2024, Transport at 2.4 percent from 1.9 percent, Recreation/Sports & Culture at 5.9 percent from 5.2 percent, Education Services at 19.8 percent from 17.2 percent, and Restaurants and Accommodation Services at 6.3 percent from 4.0 percent.
Relative to their annual rates in the previous month, lower inflation rates were observed in the indices of the following commodities:
- Food & Non-Alcoholic Beverages
- Alcoholic Beverages & Tobacco,
- Housing, Water, Electricity, Gas and Other Fuels,
- Health, and
- Personal Care and Miscellaneous Good & Services.
The indices of the rest of the commodities retained their previous months annual growth rate.
Table 2. Year-on-Year Inflation Rates of the CPI for All Income Households in Negros Occidental and Bacolod City, January 2021 to July 2024.
Month | 2021 | 2022 | 2023 | 2024 | ||||
Bacolod City | Neg Occ | Bacolod City | Neg Occ | Bacolod City | Neg Occ | Bacolod City | Neg.Occ | |
January | 3.0 | 4.1 | 3.9 | 7.6 | 12.1 | 12.2 | 2.5 | 2.2 |
February | 4.4 | 5.8 | 3.5 | 6.3 | 11.2 | 12.4 | 3.1 | 2.3 |
March | 5.5 | 6.4 | 4.3 | 7.3 | 8.7 | 10.8 | 3.3 | 2.3 |
April | 4.3 | 4.5 | 4.6 | 7.7 | 8.7 | 8.8 | 3.9 | 4.4 |
May | 5.1 | 5.2 | 4.8 | 8.2 | 7.5 | 8.3 | 4.5 | 4.2 |
June | 5.1 | 5.1 | 5.1 | 8.2 | 6.7 | 8.1 | 6.1 | 4.5 |
July | 5.0 | 4.6 | 4.2 | 8.4 | 6.6 | 7.6 | 6.2 | 4.8 |
August | 4.8 | 5.3 | 6.3 | 8.0 | 5.7 | 7.9 |
|
|
September | 3.2 | 5.3 | 6.8 | 7.8 | 6.4 | 7.6 |
|
|
October | 5.5 | 7.0 | 5.7 | 6.9 | 6.4 | 7.8 |
|
|
November | 4.7 | 6.1 | 8.7 | 11.1 | 4.2 | 4.7 |
|
|
December | 4.2 | 5.9 | 9.7 | 12.3 | 4.0 | 3.5 |
|
|
Source: Philippine Statistics Authority, Retail Price Survey of Commodities for the Generation of Consumer Price Index
JOHN F. CAMPOMANES
Chief Statistical Specialist
PSA Negros Occidental