

Release Date :
Reference Number :
SR-2025-04ANT-007
Summary Inflation Report
Consumer Price Index
(2018=100)
MARCH 2025, ANTIQUE
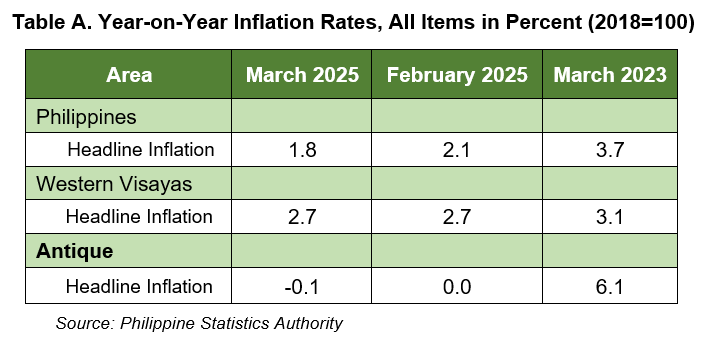
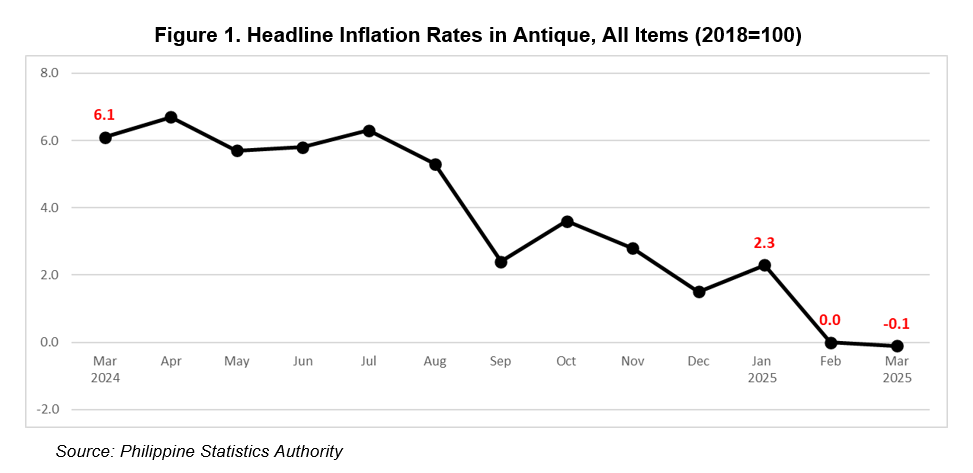
The province of Antique recorded an inflation rate of -0.1 percent in March 2025, from 0.0 percent in February 2025. The recorded inflation rate in March 2024 was significantly higher at 6.1 percent.
The March 2025 provincial inflation rate was lower as compared to the national and regional inflation rates. The inflation rate in the Philippines further slowed down to 1.8 percent in March 2025, from 2.1 percent in February 2025. The national inflation rate in March 2024 was recorded at 3.7 percent. Further, the inflation rate in Western Visayas showed no changes from its level from the previous and stayed at 2.7 percent for March 2025. Inflation rate in Western Visayas in March 2024 was recorded at 3.1 percent.
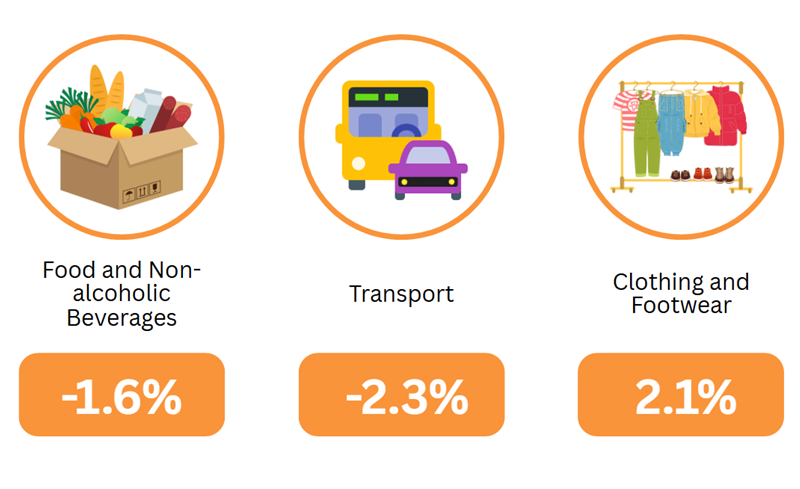
The moderate deflationary shift in price levels of the province in March 2025 was mainly influenced by the shift in price indices of Food and non-alcoholic beverages at -1.6 percent in March 2025, from -1.2 percent in February 2025; Transport at -2.3 percent in March 2025, from -1.3 percent in February 2025; and, Clothing and footwear at 2.1 percent in March 2025, from 2.3 percent in February 2025.
Furthermore, downtrends were also observed for the price indices of the following commodity groups:
a. Alcoholic beverages and tobacco, 1.3 percent; and,
b. Recreation, sport and culture, 3.0 percent.
Moreover, higher annual increments were recorded for the indices of the following commodity groups:
a. Housing, water, electricity, gas and other fuels, 2.8 percent;
b. Health, 1.9 percent; and,
c. Personal care, and miscellaneous goods and services, 2.9 percent.
The indices for the following commodity groups, however, showed no changes from its last month’s inflation rate:
a. Furnishings, household equipment and routine household maintenance, 1.9 percent;
b. Information and Communication, 0.1 percent;
c. Education services, -3.3 percent; and,
d. Restaurants and accommodation services, 2.0 percent.
The recorded inflation rate for food was recorded at -1.7 percent in March 2025, from -1.2 percent in February 2025. The food commodity group with the highest share to food inflation was Cereals and cereal products at -14.0 percent in March 2025, from -12.3 percent in February 2025.
Further, downtrends on price indices were also observed for the following food commodity groups:
a. Meat and other parts of slaughtered land animals, 2.6 percent; and,
b. Vegetables, tubers, plantains, cooking bananas and pulses, 7.9 percent.
Moreover, higher annual increments were observed for the indices of the following food commodity group:
a. Fish and other seafood, 6.2 percent;
b. Milk, other dairy products and eggs, 4.2 percent;
c. Oils and fats, -0.1 percent;
d. Fruits and nuts, 8.7 percent;
e. Sugar, confectionery and desserts, 2.4 percent; and,
f. Ready-made food and other food products, n.e.c., 2.7 percent.
RANDY M. TACOGDOY, DPA
Chief Statistical Specialist
Antique Provincial Statistical Office
/JKV