

Release Date :
Reference Number :
25PSA-0679-SR46
1. Guimaras Headline Inflation
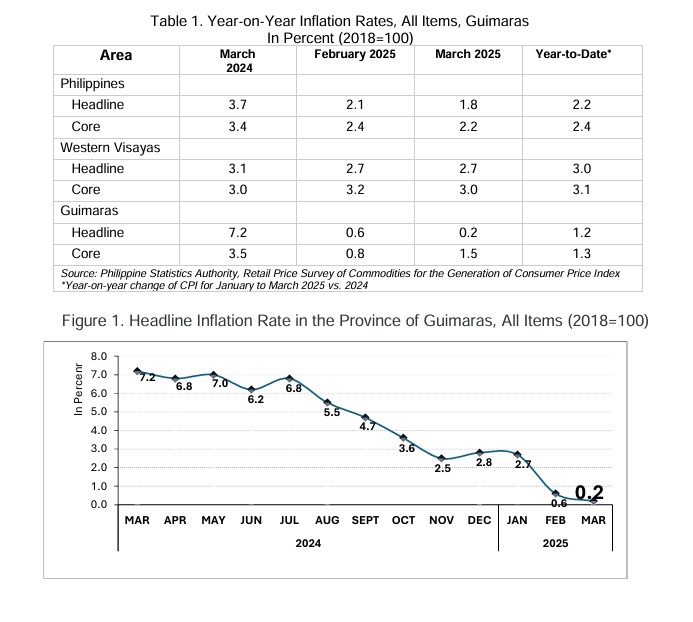
The headline inflation rate (all items) of Guimaras province slowed to 0.2 percent in March 2025 from 0.6 percent in February 2025, bringing the provincial average inflation from January to March 2025 to 1.2 percent. The inflation rate for March 2024 was at 7.2 percent. (Figure 1)
1.1 Main Drivers to the Downward Trend of the Headline Inflation
The downtrend in the overall inflation in March 2025 was primarily influenced by the decreased year on-year price change in food and non-alcoholic beverages at -0.7 percent during the month, from 0.7 percent in February 2025. The slower annual price change on housing, water, electricity, gas and other fuels at 0.9 percent in March 2025 from 2.1 percent in the previous month and personal care, and miscellaneous goods and services at 1.7 percent from 1.8 percent a month ago also contributed to the sluggish overall inflation.
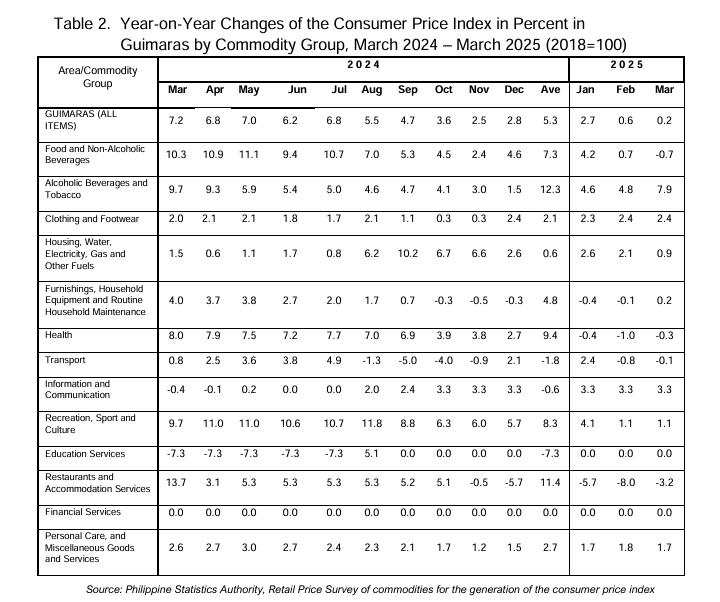
In contrast, five of the thirteen commodity groups recorded quicker inflation rates in March 2025 against February 2025:
• Alcoholic Beverages and Tobacco, 7.9% from 4.8%
• Furnishings, Household Equipment, and Routine Household Maintenance, 0.2% from -0.1%
• Health, -0.3% from -1.0%
• Transport, -0.1% from -0.8%; and
• Restaurants and accommodation services, -3.2% from -8.0%.
While the other five (5) commodities retained their previous month’s inflation rate: clothing and footwear, 2.4%; information and communication, 3.3%; recreation, sport and culture, 1.1%; education services, 0.0 %; and financial services, 0.0%.
1.2 Main Contributors to the Headline Inflation
The top two commodity groups mainly contributing to the March 2024 overall inflation were:
a. Alcoholic beverages and tobacco, with a 206.2% contribution to the province’s inflation rate, or 0.41 percentage points; and
b. Housing, water, electricity, gas, and other fuels followed closely with a 64.8% impact on the overall inflation of Guimaras, or 0.13 percentage points.
2. Guimaras Core Inflation
Core inflation, which excludes selected food and energy items, moved faster at 1.5 percent in March 2025 from 0.8 percent in the previous month. In March 2024, core inflation was higher at 3.5 percent.
The uptrend in Guimaras’ core inflation mainly driven by restaurants and accommodation services with -3.2% core inflation, sharing 50.5%, followed by alcoholic beverages and tobacco with 7.9% core inflation, splitting 20.0% and transport with 2.7% core inflation, imparting 17.3%.
In terms of contribution to overall core inflation in March 2025, alcoholic beverages and tobacco showed a large impact of 38.9% or 0.58 percentage points.
3. Headline Inflation per province in Region VI
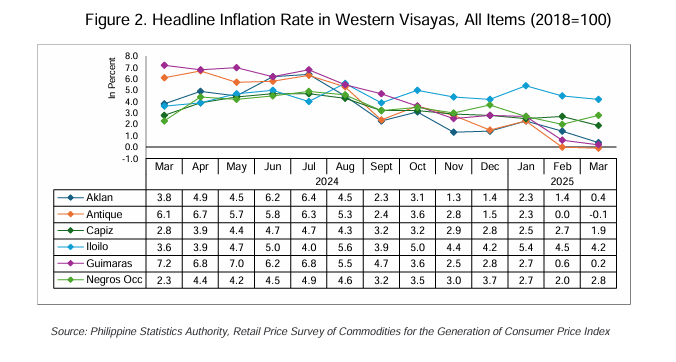
From March 2024 to March 2025, inflation rates across provinces of Western Visayas showed a general downward trend, with most areas experiencing their peak between April and July 2024.
Guimaras recorded the highest inflation at 7.2% in March 2024, while Antique peaked at 6.7% in April. Aklan also noted a high of 6.4% in July. However, by March 2025, significant declines were observed across all provinces, with Antique even entering deflation at -0.1% and Guimaras dropping to just 0.2%. Iloilo maintained relatively stable inflation throughout the period, ending at 4.2%.
4. Guimaras Purchasing Power of the Peso (PPP)
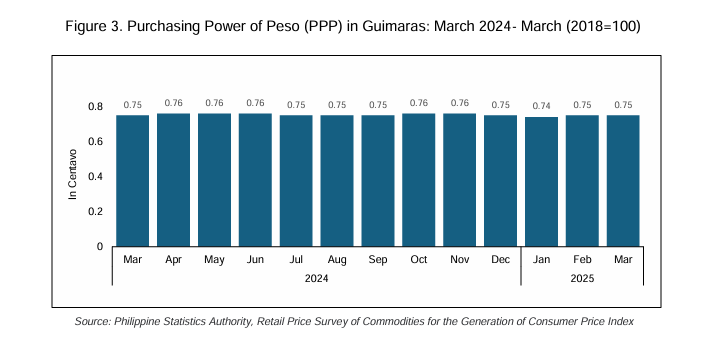
The Purchasing Power of the Peso (PPP) in Guimaras from March 2024 to March 2025 illustrates a consistent depreciation trend since 2018 (base year), revealing that the one peso in 2018 is now equivalent to only 0.75 centavos in March 2025, indicating the continued decline in the peso value over time.
The data for the past 13 months shows fluctuating movements in PPP, with periods of both decline and minor recovery. In March 2024, the PPP stood at 0.75, and improved slightly from April to June 2024 to 0.76. However, it declined again to 0.75 from July to September 2024. A brief increase was recorded in October to November 2024 at 0.76, but this was followed by another drop to 0.75 in December.
In January 2025, the PPP declined further to 0.74, the lowest level within the period, before slightly recovering to 0.75 in February and March 2025. This pattern underscores the weakening purchasing power of the peso, highlighting how inflation continues to erode its real value over time.
DEFINITION OF TERMS
Inflation Rate
Rate of change in the Consumer Price Index. Its formula is given by:
Year-on-year inflation
Rate of change in the Consumer Price Index in a specific period of the current year relative to the same period in the previous year.
Month-on-Month inflation
Rate of change in the Consumer Price Index in a specific period of the current month relative to the previous month in the current year.
Consumer Price Index
Indicator of the change in the average prices of a fixed basket of goods and services commonly purchased by an average Filipino household for their day-to-day consumption relative to a base year. It is most widely used in the calculation of the inflation rate and purchasing power of the peso (PPP).
Relative to this, daily, weekly, and bi-monthly price surveys are conducted nationwide at the provincial offices including the District Offices of the National Capital Region (NCR) to be able to generate monthly CPI for All Income Households and CPI for the Bottom 30% Income Households. Indicators produced from price surveys are regarded as designated statistics.
The seasonally adjusted CPI provides comparisons after removing the seasonal variations that may affect the series. The formula used in computing the CPI is the weighted arithmetic mean of price relatives, the Laspeyre’s formula with a fixed base year period (2018) weights given by.
Purchasing Power of Peso (PPP)
Indicates how much the Philippine Peso is worth in each period relative to its value in a base period. It is computed by getting the reciprocal of the CPI and multiplying the result by 100 given by the equation:
Headline Inflation
Defined as the rate of change in the weighted average prices of all goods and services in the CPI basket while Core Inflation refers to the rate of change in the CPI which excludes the following item/commodity groups: rice, corn, fruits and vegetables, and fuel items.
Attachment