

Release Date :
Reference Number :
25PSA-0679-SR36
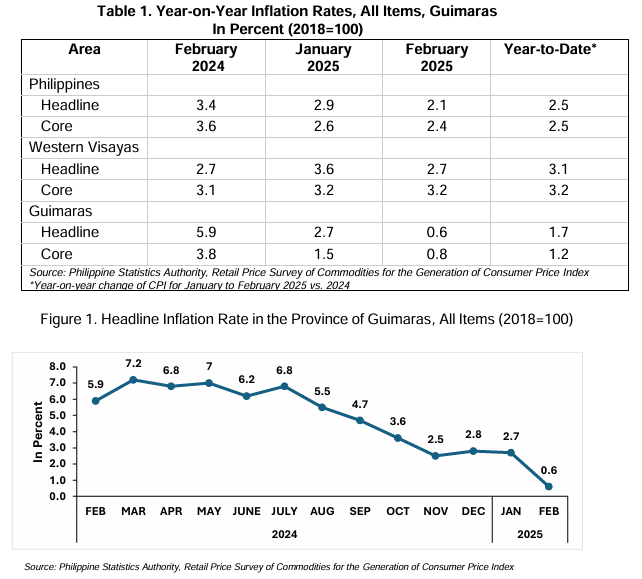
1. Guimaras Headline Inflation
The Guimaras’ headline or overall inflation moved slower to 0.6 percent in February 2025 from 2.7 percent in January 2025, bringing the provincial average inflation from January to February 2025 to 1.7 percent. The February 2024 inflation rate was at 3.4 percent. (Figure 1)
1.1 Main Drivers to the Downward Trend of the Headline Inflation
The downtrend in the overall inflation in February 2025 was primarily influenced by the decreased year-on-year price change in the heavily weighted food and non-alcoholic beverages at 0.7 percent during the month, from 4.2 percent in January 2025. The slower annual price change on transport at -0.8 percent in February 2025 from 2.4 percent in the previous month and restaurants and accommodation services at -8.0 percent from -5.7 percent a month ago also contributed to the slower inflation rate.
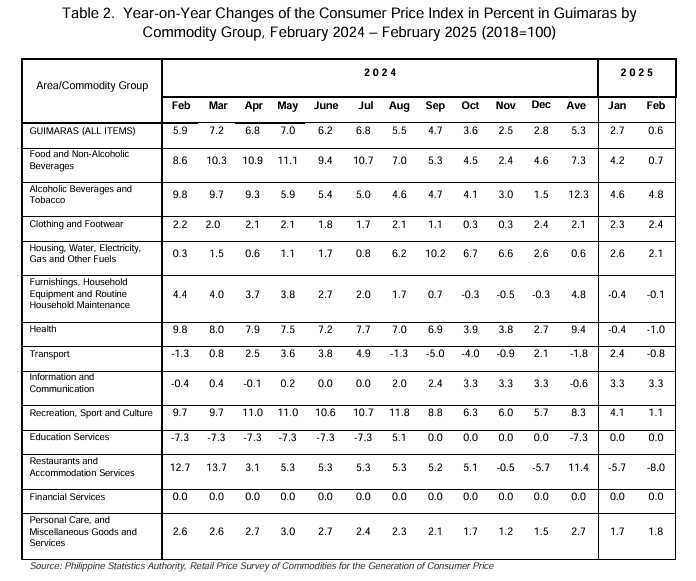
Likewise, the slow-moving inflation rate was also noted in the other three commodity groups: Housing, Water, Electricity, Gas and other Fuels at 2.1 percent in February from 2.6 percent in January 2025; and Recreation, Sport and Culture at 1.1 percent in February from4.1 percent in January 2025.
In contrast, the following were the items with faster inflation in February than in January 2025:
• Alcoholic Beverages and Tobacco, 4.8 percent from 4.6 percent
• Clothing and Footwear, 2.4 percent from 2.3 percent
• Furnishings, Household Equipment and Routine Household Maintenance, -0.1 percent from -0.4 percent
• Health at -1.0 percent in February from -0.4 percent in January 2025
• Personal Care, and Miscellaneous Goods and Services, 1.8 percent from 1.7 percent
While the other 3 commodities retained their previous month’s inflation rate (Information and Communication: 3.3 percent, Education Services: 0.0 percent, and Financial Services; 0.0 percent).
1.2 Main Contributors to the Headline Inflation
In February 2025, the overall inflation rate in Guimaras was primarily influenced by three major commodity groups: the largest contributor was food and non-alcoholic beverages at 57.2 percent of the province’s inflation rate, or 0.34 percentage points contribution to the overall inflation, with the notable surge primarily driven by a significant 38.3% increase in carrots and turnips, impacting overall food costs.
Housing, water, electricity, gas, and other fuels followed closely at 54.3 percent, or 0.33 percentage points contribution to the inflation, with a significant impact from wood and bamboo charcoal—showing an inflation rate of 7.2%.
Lastly, Alcoholic Beverages and Tobacco contributed 27.2 percent, or 0.16 percentage points, to the overall inflation with the increase largely driven by a remarkable 8.0% inflation rate in Beer.
2. Guimaras Core Inflation
In February 2025, core inflation in Guimaras fell to 0.8%, up from 1.5% in January. This decrease indicates a slight deceleration in underlying inflation.
Core inflation excludes volatile items such as food and energy, providing a clearer perspective on long-term price trends.
In Guimaras, core inflation dropped significantly from 3.8% in February 2024 to 0.8% in February 2025, indicating easing price pressures. The transport sector had the highest impact on inflation, contributing 35.5%, followed by food and non-alcoholic beverages (32.2%) and restaurants and accommodation services (24.9%). Some sectors, such as health and recreation, also experienced slower prices in February 2025.
3. Headline Inflation per province in Region VI
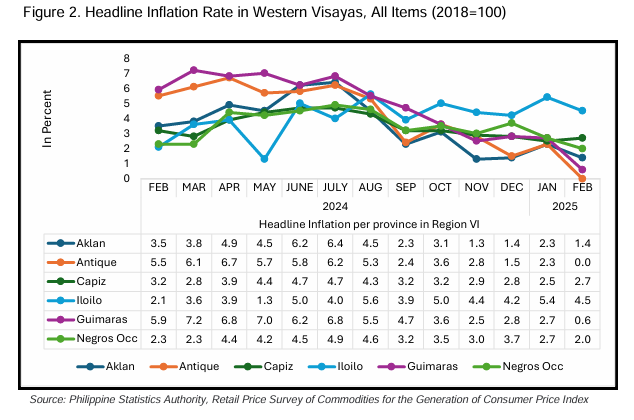
Guimaras records sharpest inflation drop in Region VI
Guimaras posted the most significant inflation decline in Region VI, dropping from 7.2% in March 2024 to 0.6% in February 2025, based on the latest data from the Philippine Statistics Authority.
Antique also recorded a notable decrease, falling from 6.7% in April 2024 to 0.0% in February 2025. Meanwhile, Aklan and Capiz experienced moderate inflation trends, peaking at 6.4% and 4.7%, respectively, before stabilizing at 1.4% and 2.7% in early 2025. Iloilo and Negros Occidental followed steadier patterns, with Iloilo recording 5.6% in August 2024 before easing to 4.5%, while Negros Occidental peaked at 4.9% in July 2024 before settling at 2.0%. Despite overall declines across the region, Iloilo and Capiz maintained more stable inflation rates compared to the sharp drops in Guimaras and Antique.
4. Guimaras Purchasing Power of the Peso (PPP)
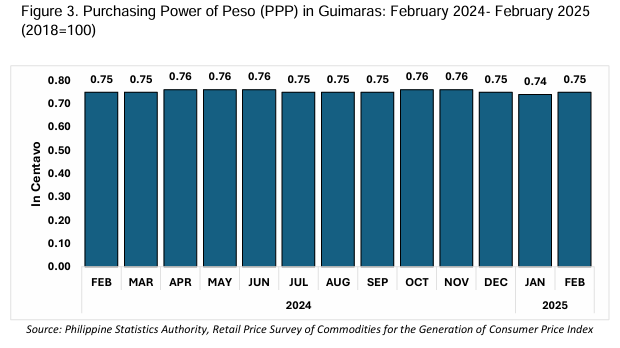
The Purchasing Power of the Peso (PPP) in Guimaras reflects the real value of money in terms of its ability to purchase goods and services, adjusted for inflation.
A PPP of 1.00 indicates that the peso retains its full value compared to the base year, while a value less than 1.00 shows that inflation has reduced the purchasing power of the peso over time. Since the base year of 2018, Guimaras has seen a consistent decrease in PPP, highlighting a gradual loss in the peso value.
In February 2024, the PPP in Guimaras was at 0.75, meaning that one peso could buy only 75% of the goods and services it could have purchased in 2018. This depreciation maintained in 2025, with the PPP 0.75 in February.
Throughout the year, the PPP fluctuated between 0.74 and 0.76, reflecting a consistent erosion in purchasing power. From February to March 2024, the PPP remained at 0.75.
Between April and August, it stabilized between 0.75 and 0.76, suggesting that while inflation persisted, the peso value remained relatively steady.
However, in the latter part of the year, from September to December, the PPP hovered between 0.75 and 0.76, showing little improvement or deterioration in purchasing power. This indicates that inflation continued to have a moderate, ongoing impact on the residents of Guimaras.
Overall, while fluctuations in PPP were minimal, the trend points to a steady reduction in purchasing power, reflecting the persistent influence of inflation across various sectors like food, housing, and transportation.
DEFINITION OF TERMS
Inflation Rate
Rate of change in the Consumer Price Index. Its formula is given by:
Year-on-year inflation
Rate of change in the Consumer Price Index in a specific period of the current year relative to the same period in the previous year.
Month-on-Month inflation
Rate of change in the Consumer Price Index in a specific period of the current month relative to the previous month in the current year.
Consumer Price Index
Indicator of the change in the average prices of a fixed basket of goods and services commonly purchased by an average Filipino household for their day-to-day consumption relative to a base year. It is most widely used in the calculation of the inflation rate and purchasing power of the peso (PPP).
Relative to this, daily, weekly, and bi-monthly price surveys are conducted nationwide at the provincial offices including the District Offices of the National Capital Region (NCR) to be able to generate monthly CPI for All Income Households and CPI for the Bottom 30% Income Households. Indicators produced from price surveys are regarded as designated statistics.
The seasonally adjusted CPI provides comparisons after removing the seasonal variations that may affect the series. The formula used in computing the CPI is the weighted arithmetic mean of price relatives, the Laspeyre’s formula with a fixed base year period (2018) weights given by.
Purchasing Power of Peso (PPP)
Indicates how much the Philippine Peso is worth in each period relative to its value in a base period. It is computed by getting the reciprocal of the CPI and multiplying the result by 100 given by the equation:

Headline Inflation
Defined as the rate of change in the weighted average prices of all goods and services in the CPI basket while Core Inflation refers to the rate of change in the CPI which excludes the following item/commodity groups: rice, corn, fruits and vegetables, and fuel items.
Attachment