

Release Date :
Reference Number :
SR 2024-0604-008
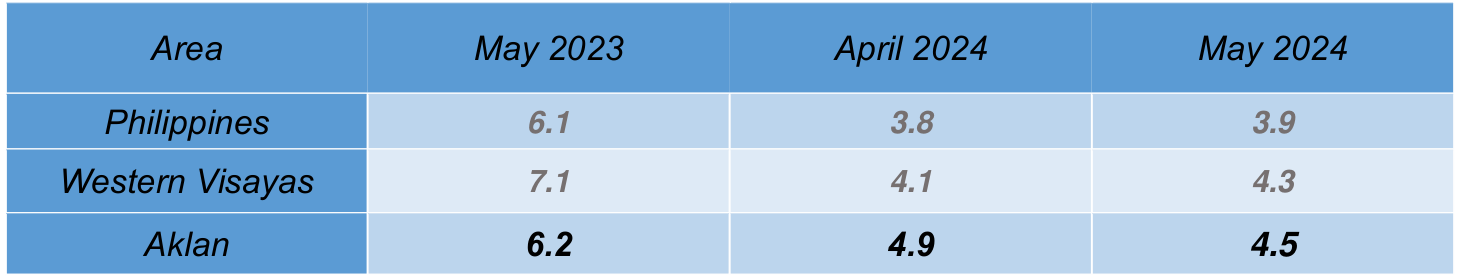
In March 2024, the headline inflation rate in Aklan grew at a slower rate of 4.5 percent compared to 4.9 percent in the previous month. This marks a notable decrease of 1.7 percentage points from the 6.2 percent inflation observed in May 2023. Aklan's inflation rate exceeds both the national and regional rates, which stand at 3.9 percent and 4.3 percent, respectively.
In percent
(2018=100)
Source: Retail Price Survey of Commodities for the Generation of Consumer Price Index, Philippine Statistics Authority
The primary factor contributing to the downtrend in inflation this month was the Food and Non-Alcoholic Beverages category, which showed a slower inflation rate of 8.8 percent compared to 10.1 percent in the previous month. Within this category, rice played a significant role, with its inflation rate decreasing from 35.5 percent in April 2024 to 32.9 percent in May 2024.
Additionally, the inflation rate for Vegetables, Tubers, Plantains, Cooking Bananas, and Pulses NEC declined sharply from -3.4 percent in April 2024 to -10.2 percent in May 2024. Fruits and Nuts also showed a decrease, from 3.3 percent inflation last month to -2.6 percent this month. Most of the food sub-commodities exhibited slower inflation rates in May 2024, except for Oils and Fats and Ready-Made Food and Other Food Products NEC, which increased by 0.7 percent and 5.3 percent, respectively.
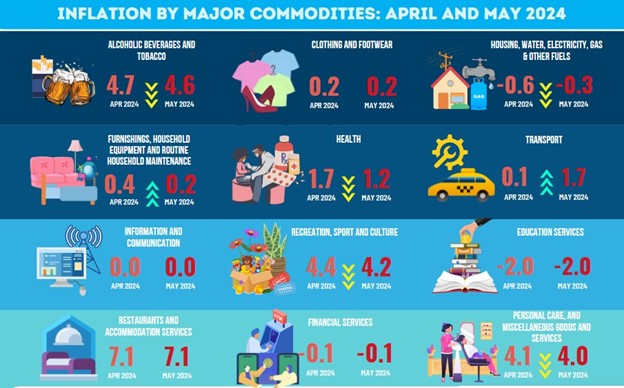
Among other major commodity groups, Health showed a decrease in inflation to 1.2 percent this month from 1.7 percent in April 2024. Furnishings, Household Equipment, and Routine Household Maintenance also decreased from 0.4 percent last month to 0.2 percent this month. Meanwhile, Personal Care, Miscellaneous Goods and Services, Recreation, Sport and Culture, and Alcoholic Beverages and Tobacco also exhibited slower inflation in May 2024.
Only Housing, Water, Electricity, Gas and Other Fuels, and Transport commodities showed faster inflation from April to May 2024, with rates of -0.3 percent and 1.7 percent, respectively. Inflation for the rest of the major commodities remained stable from April to May 2024.
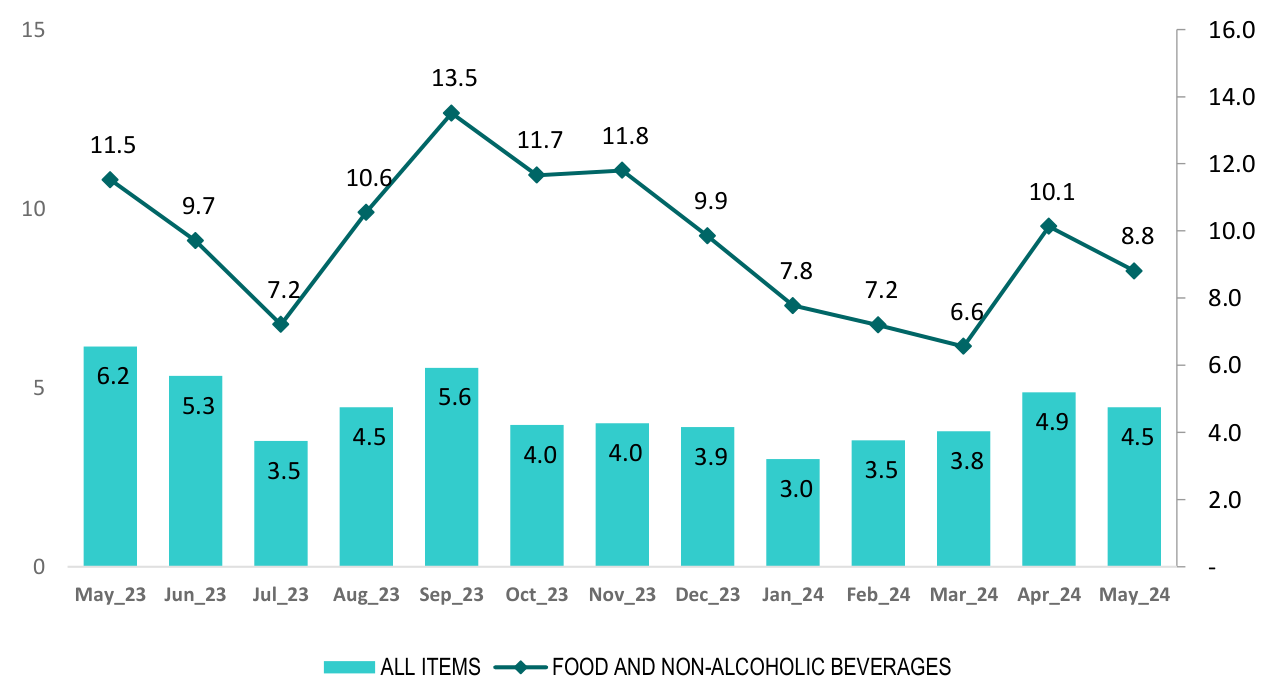
Aklan: May 2023 to May 2024
Source: Retail Price Survey of Commodities for the Generation of Consumer Price Index, Philippine Statistics Authority
Major Contributors to Inflation
The overall inflation of Aklan was mainly brought by lower price hike of Food and Non-Alcoholic Beverages which recorded 8.8 percent inflation with 79.4 percent share to overall inflation. This was followed by Restaurants and accommodation services at 7.1 percent inflation with 9.3 percent share to inflation, and Personal care, and miscellaneous goods and services with 4.0 percent inflation and 4.1 percent share to inflation.
Other major commodity groups also contributed to the province’s inflation rate in May 2024:
- Transport, 1.7 percent inflation with 3.5 percent share;
- Alcoholic beverages and tobacco, 1.8 percent inflation with 2.7 percent share;
- Recreation, sport and culture,4.2 percent inflation with 1.3 percent share; and
- Health, 1.2 percent inflation with 1.1 percent share.
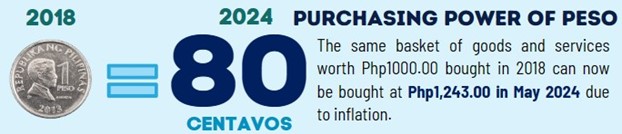
The purchasing power of peso (PPP) is inversely associated with inflation, which implies that as inflation increases, the purchasing power of peso decreases.
PPP in May 2024 was valued at 80 centavos, lower than 84 centavos recorded PPP in the same month last year.
This indicates that a 1000-peso worth of goods and services bought in 2018 will require a person an additional P243.00 in order to buy them in May 2024.
Moreover, 8.8 percent inflation in food commodities results in an additional P294.00this May 2024 in order to buy the same basket of food commodities worth P1000.00 in 2018.
| CPI | |||||
| Commodity Group | May-23 | Apr-24 | May-24 | Month- on- Month | Year- to- Year |
| ALL ITEMS | 119 | 124.8 | 124.3 | 1.2 | 6.2 |
| I. FOOD AND NON-ALCOHOLIC BEVERAGES | 118 | 129.3 | 128.4 | 1.8 | 11.2 |
| * Food | 118.4 | 130.4 | 129.4 | 1.9 | 11.9 |
| Cereals and Cereal Products | 95.3 | 118.4 | 120.1 | 0.4 | 27.9 |
| Cereals | 90.2 | 117.4 | 119.6 | 0.4 | 35.1 |
| Rice | 90 | 117.4 | 119.5 | 0.4 | 35.4 |
| Corn | 123 | 124.7 | 124.7 | 0 | 1.6 |
| Flour, Bread and Other Bakery Products, Pasta Products, and Other Cereals | 117.5 | 122.6 | 122.7 | 0 | 4.4 |
| Meat and Other Parts of Slaughtered Land Animals | 134.8 | 159.1 | 159.6 | -0.4 | 26.7 |
| Fish and Other Seafood | 123.6 | 125.8 | 119.2 | 2.6 | -4.7 |
| Milk, Other Dairy Products, and Eggs | 125.8 | 130.3 | 130 | 0 | 3.3 |
| Oils and Fats | 134.9 | 135.6 | 135.8 | 0.1 | 0.7 |
| Fruits and Nuts | 139.4 | 137.1 | 135.8 | -2.3 | -1.8 |
| Vegetables, Tubers, Cooking Bananas and Pulses | 140.7 | 130.7 | 126.4 | 15.1 | -0.9 |
| Sugar, Confectionery and Desserts | 145.1 | 134.6 | 134.1 | 0 | -8.5 |
| Ready-Made Food and Other Food Products N.E.C. | 120.5 | 124.8 | 126.9 | 4.3 | 8.8 |
| * Non-alcoholic Beverages | 111.6 | 113.5 | 113.6 | 0 | 1.2 |
| II. ALCOHOLIC BEVERAGES AND TOBACCO | 167.2 | 174.9 | 174.9 | 0 | 4.9 |
| Alcoholic Beverages | 121.9 | 128.7 | 128.7 | 0 | 5.6 |
| Tobacco | 120.7 | 228.5 | 228.5 | 0 | 4.4 |
| Other Vegetable-Based Tobacco Products | |||||
| NON-FOOD | 117.3 | 119 | 118.9 | 0.8 | 2.5 |
| III. CLOTHING AND FOOTWEAR | 106.3 | 106.5 | 106.5 | 0 | 0.2 |
| Clothing | 107 | 107.1 | 107.2 | 0 | 0.2 |
| Footwear | 104.9 | 105.1 | 105.1 | 0 | 0.2 |
| IV. HOUSING, WATER, ELECTRICITY, GAS AND OTHER FUELS | 123.7 | 123.6 | 123.3 | 2.1 | 2.6 |
| Actual Rentals for Housing | 126.6 | 126.6 | 126.6 | 0 | 0 |
| Maintenance, Repair and Security of the Dwelling | 112.9 | 108.3 | 108.3 | 0 | -3 |
| Water Supply and Miscellaneous Services Relating to the Dweling | 97.7 | 97.7 | 97.7 | 0 | 0 |
| Electricity, Gas and Other Fuels | 122.9 | 122.9 | 122 | 6.7 | 8.6 |
| V. FURNISHINGS, HOUSEHOLD EQUIPMENT AND ROUTINE HOUSEHOLD MAINTENANCE | 124.9 | 125.1 | 125.1 | 0 | 0.5 |
| Furniture and Furnishings, and Loose Carpets | 111.2 | 110.9 | 110.9 | 0 | 0.5 |
| Household Textiles | 103.8 | 104 | 104 | 0 | 0.7 |
| Household Appliances | 107.6 | 107.3 | 107.3 | 0 | -0.5 |
| Glassware, Tableware and Household Utensils | 107 | 107.4 | 107.4 | 0 | 0.4 |
| Tools and Equipment for House and Garden | 108.7 | 111.6 | 111.6 | 0 | 2.7 |
| Goods and Services for Routine Household Maintenance | 132.5 | 132.9 | 132.9 | 0 | 0.6 |
| VI. HEALTH | 115.5 | 116.9 | 116.9 | 0 | 1.3 |
| Medicines and Health Products | 116.3 | 118.6 | 118.6 | 0 | 2.1 |
| Outpatient Care Services | 122.5 | 122.5 | 122.5 | 0 | 0 |
| Inpatient Care Services | 110.3 | 110.3 | 110.3 | 0 | 0 |
| Other Health Services | 120.6 | 120.6 | 120.6 | 0 | 0 |
| VII. TRANSPORT | 121.6 | 123.8 | 123.7 | -0.2 | 1.6 |
| Purchase of Vehicles | 102.8 | 102.8 | 102.8 | 0 | 0 |
| Operation of Personal Transport Equipment | 113.1 | 118.2 | 116.5 | -1 | 1.9 |
| Passenger Transport Services | 142.7 | 144.5 | 145.5 | 0.2 | 2.5 |
| Transport Services of Goods | 104 | 107.8 | 107.8 | 0 | 3.7 |
| VIII. INFORMATION AND COMMUNICATION | 103.1 | 103.1 | 103.1 | 0 | 0 |
| Information and Communication Equipment | 104.6 | 104.6 | 104.6 | 0 | 0 |
| Information and Communication Services | 1022 | 102.2 | 102.2 | 0 | 0 |
| IX. RECREATION, SPORT AND CULTURE | 108 | 112.5 | 112.5 | 0 | 4.6 |
| Recreational Durables | 100 | 100 | 100 | 0 | 0 |
| Other Recreational Goods | 106.5 | 106.8 | 106.8 | 0 | 0.3 |
| Garden Products and Pets | 116.4 | 117.4 | 117.4 | 0 | 4.4 |
| Recreational Services | 92.3 | 92.3 | 92.3 | 0 | 0 |
| Cultural Goods | 100.3 | 100.3 | 100.3 | 0 | 0 |
| Cultural Services | 103 | 103 | 103 | 0 | 0 |
| Newspapers, Books and Stationery | 115.7 | 132.6 | 132.6 | 0 | 14.1 |
| Package Holidays | |||||
| X. EDUCATION SERVICES | 116.5 | 114.2 | 114.2 | 0 | -2 |
| Early Childhood and Primary Education | 147.1 | 136 | 136 | 0 | -7.5 |
| Secondary Education | 108.6 | 106.1 | 106.1 | 0 | -2.3 |
| Tertiary Education | 105.1 | 107.8 | 107.8 | 0 | 2.6 |
| Education Not Defined by Level | |||||
| XI. RESTAURANTS AND ACCOMMODATION SERVICES | 110.3 | 118.1 | 118.1 | 0 | 7.1 |
| Food and Beverage Serving Services | 111.3 | 119.9 | 119.9 | 0 | 7.7 |
| Accommodation Services | 100 | 100 | 100 | 0 | 0 |
| XII. FINANCIAL SERVICES | 145.5 | 145.3 | 145.3 | 0 | -0.1 |
| Financial Services | 145.5 | 145.3 | 145.3 | 0 | -0.1 |
| XIII. PERSONAL CARE, AND MISCELLANEOUS GOODS AND SERVICES | 106.9 | 111 | 111.2 | 0 | 4 |
| Personal Care | 106.8 | 111.8 | 112.1 | 0 | 5 |
| Other Personal Effects | 107.4 | 107.6 | 107.6 | 0 | 0.2 |
| Other Services | 100.4 | 100.4 | 100.4 | 0 | 0 |
Source: Retail Price Survey of Commodities for the Generation of Consumer Price Index, Philippine Statistics Authority
EXPLANATORY TEXT
Consumer Price Index (CPI) - is an indicator of the change in the average retail prices of a fixed basket of goods and services commonly purchased by the households relative to a base year. It shows how much on the average, prices of goods and services have increased or decreased from a particular reference period.
The CPI Report was derived from the results of the 2018-based CPI survey comprised of thirteen (13) major commodity groups. These are the following: Food and Non-alcoholic Beverages; Alcoholic Beverages and Tobacco; Clothing and Footwear; Housing, Water, Electricity, Gas and Other Fuels; Furnishings, Household Equipment and Routine Maintenance of the House; Health; Transport; Information and Communication Services; Recreation, Sport and Culture; Education; Restaurants and Accommodation Services; Financial Services; and Personal Care and Miscellaneous Goods and Services.
Inflation rate is defined as the annual rate of changeor the year-on-year change in the
CPI.
Purchasing power of peso is a measure of the real value of the peso in a given period relative to a chosen reference period.
Market basket is a term used to refer to a sample of goods and services that are commonly purchased and bought by an average Filipino household.
Base period or Base Year is the period, usually a year, at which the index number is set to 100. It is the reference point of the index number series. In this report,2018 is used as the base period.
ENGR. ANTONET B. CATUBUAN
Chief Statistical Specialist