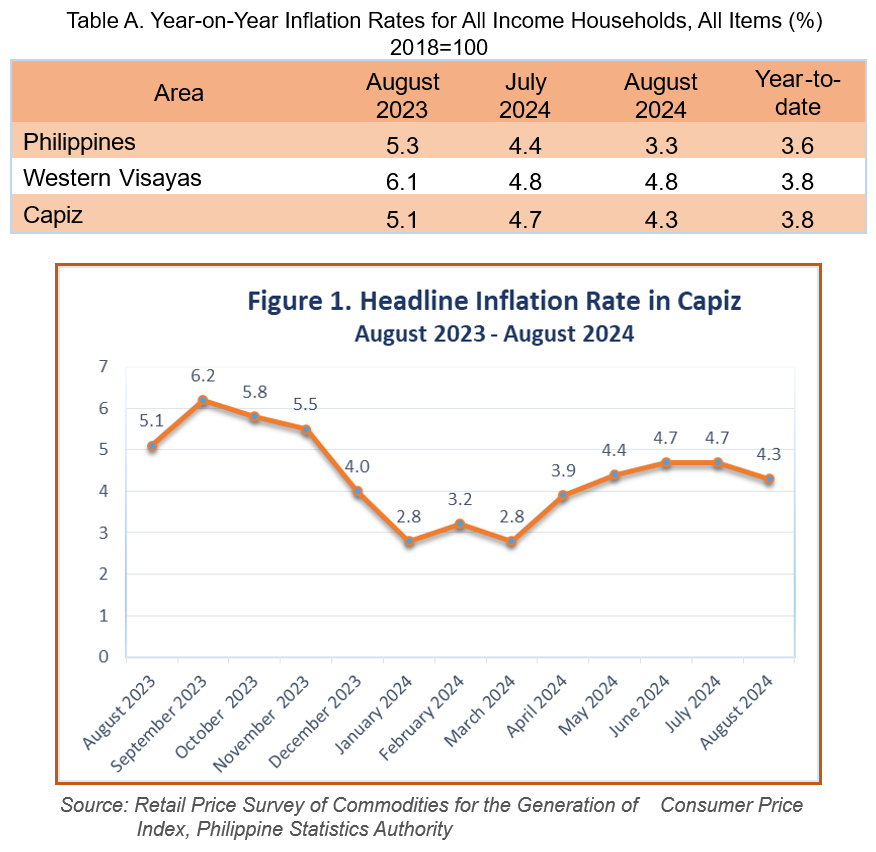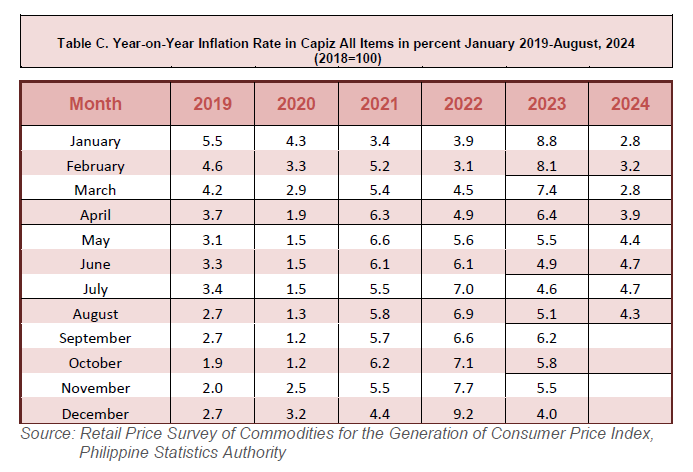
The headline inflation in the province of Capiz decreased to 4.3 percent in August 2024 from 4.7 percent in July 2024. This marks the third-highest inflation recorded so far in 2024, but it is still the sixth lowest in the last twenty-four months since the base year was changed to 2018. In comparison, inflation in August 2023 was higher at 5.1 percent. The average inflation in the province of Capiz for the year stood at 3.8 percent. This average for Western Visayas also stood at 3.8 percent, which is 0.2 percent higher than the national average inflation of 3.6 percent. (Table A and Figure 1)

The provincial inflation slowed down due to a decrease in the index of the most heavily weighted commodity group, Food and Non-Alcoholic Beverages, at 6.9 percent compared to 7.5 percent in July 2024. This decrease was driven by one of the most weighted commodities in the group, particularly Rice, which decreased to 17.3 percent from 22.0 percent in July 2024.
The Non-Food Commodity group also suffered a decline at 1.9 percent when compared to the previous period at 2.2 percent. This was headed by Transport at -2.3 percent vs 0.7 percent in its previous period, together with Education Services at 4.1 percent vs 6.8 percent in the previous month.
On the other hand, commodities in the Non-Food group that showed an annual inflation rate growth include Housing, Water, Electricity, Gas and other fuels at 4.0 percent vs 3.0 percent in July 2024, along with Personal Care and Miscellaneous goods at 2.6 percent vs 2.1 percent in the previous period. Other commodities in the group either retained their previous mark or had a negligible percent annual change.
Conversely, many commodities in the food index group have accelerated during the period. Led by Vegetables, tubers, plantains, cooking bananas, and pulses at 4.5 percent vs 2.4 percent in July 2024, Ready-made Food and Other Food Products NEC index at 8.6 percent vs 8.4 percent, Oils and Fats at 1.6 percent during the reference period from 1.4 percent in the past month, together with Fish and Other Seafoods at -1.8 percent vs -2.4 percent in the previous period.
In the meantime, the following food groups exhibited an annual change or retained their previous mark during the period:
- Sugar, Confectionery & Dessert -4.0 percent vs -3.9 percent in July 2024
- Milk and Other Dairy products & Egg , 2.3 percent vs 2.2 percent in July 2024
- Flour, Bread and Other Bakery Products, Pasta products and other Cereals,
2.0 percent vs 2.0 percent
- Meat and Other Parts of Slaughtered Land Animals, 20.1 percent vs 20.5 percent.
- Fruits and Nuts, 4.4 percent vs 4.4 percent
- Corn, 3.0 percent vs 4.1 percent
In addition, the annual rate of non-alcoholic beverages remains unchanged at 0.7 percent compared to the previous period. Similarly, the annual rate of alcoholic beverages and tobacco also remains steady at 2.7 percent during the reference period compared to the preceding month's index (Table B).


