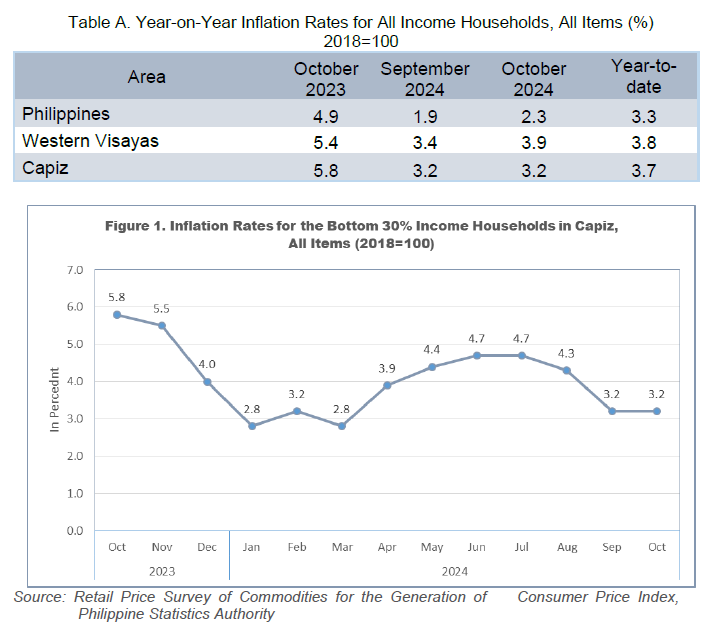
Headline inflation in the province of Capiz reached 3.2 percent in October 2024, the same rate recorded in September 2024. This marks the second-lowest inflation rate for 2024 and the lowest recorded in the last twenty-four months since the base year was changed to 2018. In comparison, inflation in October 2023 was higher at 5.8 percent. The average inflation in Capiz for the year remains at 3.7 percent. For Western Visayas, the average stands at 3.8 percent, which is 0.5 percent higher than the national average inflation rate of 3.3 percent (see Figure 1, Table A, and Table D).
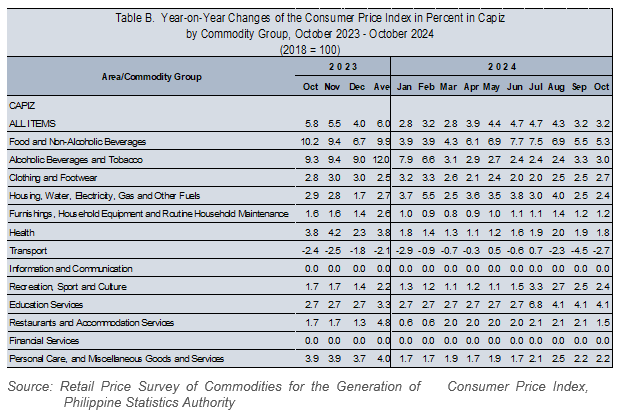
The relatively stable inflation in the province can be attributed to a minimal decrease in the index of the most heavily weighted commodity group, Food and Non-Alcoholic Beverages, which fell from 5.5 percent in September 2024 to 5.3 percent in October. This decline was partially offset by a slight increase in the Non-Food commodity group, which rose from 1.0 percent in September to 1.2 percent in October 2024.The surge in the Non-Food commodity group was primarily driven by an improvement in the Transport category, which showed a decrease of -2.7 percent compared to -4.5 percent in the previous month. Additionally, Clothing and Footwear experienced an increase, rising to 2.7 percent from 2.5 percent in September 2024 (see Table B and Table C).

Other non-food commodity groups either suffered a decline or maintained their previous marks during the period such as:
1. Housing, Water, Electricity, Gas, and other fuels, 2.4 percent vs 2.5 percent
2. Furnishing, household equipment, and routine household maintenance, 1.2 percent vs 1.2 percent.
3. Health, 1.8 percent vs 1.9 percent
4. Recreation, Sport and Culture, 2.4 percent vs 2.5 percent
5. Education Services, 4.1 percent vs 4.1 percent in the previous month.
6. Restaurant and accommodation services, 1.5 percent vs 2.1 percent
7. Personal care and Miscellaneous goods services 2.2 percent vs 2.2 percent

The largest decline in the Food and Non-Alcoholic Commodity Group items occurred in Meat and Other Parts of Slaughtered Land Animals, which fell from 11.2 percent to 8.5 percent in September 2024. Additionally, Fruits and Nuts also saw a decrease, dropping from 3.3 percent to 2.7 percent in the same month.
During this period, several food commodities within the food index group have experienced price increases. Notably, the cost of oils and fats rose from 1.1 percent in September 2024 to 4.9 percent. Additionally, prices for fish and other seafood improved slightly, increasing from -1.8 percent to -0.9 percent during the same timeframe (see Table C). Meanwhile, other food groups either showed no annual change or maintained their previous levels during this period.
- Sugar, Confectionery & Dessert -2.0 percent vs -2.0 percent in Sept 2024
- Milk and Other Dairy products & Egg 2.6 percent vs 1.5 percent
- Flour, Bread and Other Bakery Products, Pasta products and other Cereals, 2.6 percent vs 1.3 percent
- Rice, 20.8 percent vs 20.0 percent.
- Fruits and Nuts, 2.7 percent vs 3.3 percent
- Corn, 0.4 percent vs 0.9 percent
The annual rate for non-alcoholic beverages is slightly lower at 0.6 percent, down from 0.7 percent in September 2024. Similarly, the rate for alcoholic beverages and tobacco also decreased to 3.0 percent during this reference period, compared to 3.3 percent in the previous month (see Table C).


