

Release Date :
Reference Number :
2024 – 09
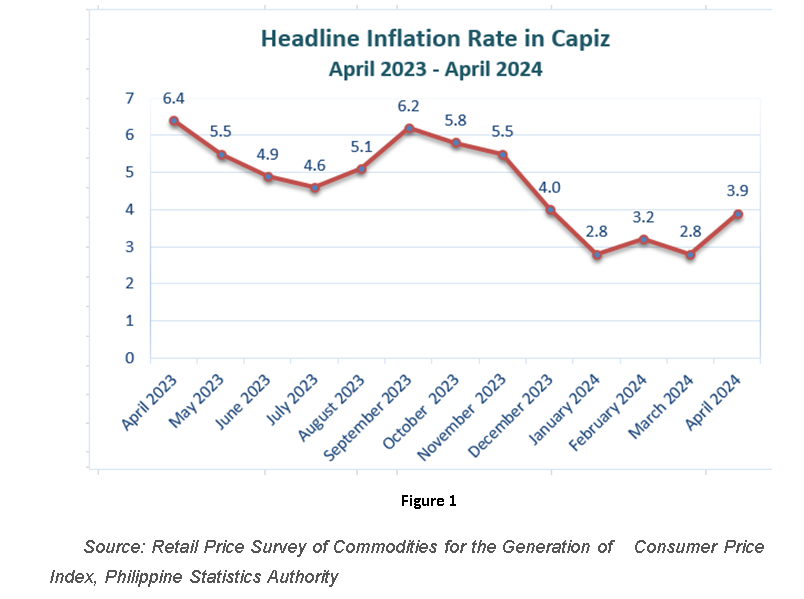
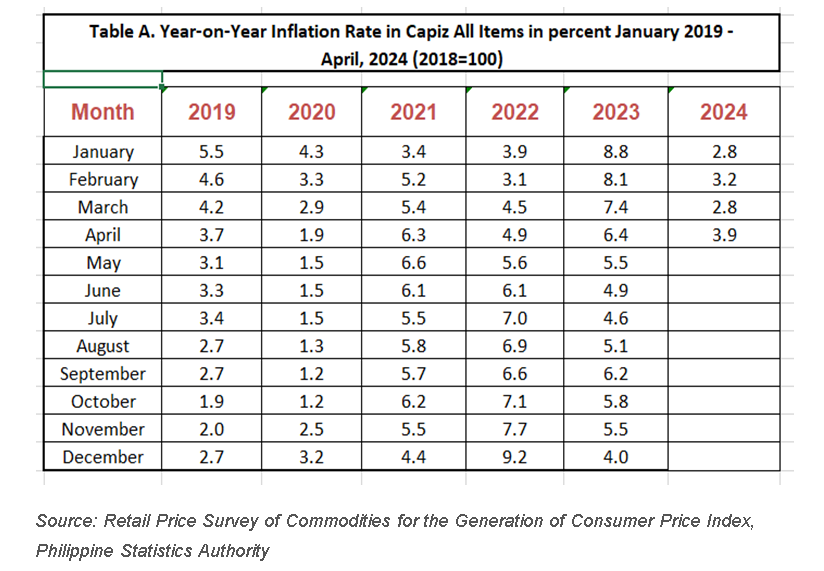
The headline inflation in the province of Capiz picked up to 3.9 percent in April 2024 from 2.8 percent recorded in March 2024. This is the highest recorded inflation so far for the year 2024, but still the fourth lowest in the last twenty eight months since the base year was changed to 2018. Inflation in April 2023 was at 6.4 percent. The average inflation for the year stood at 3.0 percent. (Figure 1 and Table A)
The sudden surge in the provincial inflation for April 2024 after a drop from the previous period was mainly caused by a noticeable annual increase in the index of the most heavily weighted commodity group of Cereals and Cereals Products at 12.2 percent vs 10.7 percent in March 2024. This was led by the most weighted items in the provincial CPI which is Rice at 15.7 percent vs 13.7 percent in the previous month.
Generally, the Non Food Commodity group also escalated at 1.9 percent when compared to the previous period at 1.5 percent. This was headed by Housing, Water, Electricity, Gas and other fuels at 3.6 percent vs 2.5 percent in March 2024, followed by Transport at -0.3 percent vs -0.7 percent in its previous period. (Table 4)
On the other hand, the annual inflation rate of Clothing and Footwear has shown a drop at 2.1 percent vs 2.6 percent in March 2024, together with Health at 1.1 percent vs 1.3 percent in the previous period and Personal Care and Miscellaneous Goods and Services at 1.7 percent vs 1.9 percent in the previous month with other commodities that belong to the group had either retain its previous mark or have negligible percent annual change. (Table 4)
The overall food index has increase at 6.4 percent in April 2024 from 4.6 percent in the previous month. In April 2023, food index was much higher at 10.7 percent. Showing the way for the period was the notable surge of Fruits and Nuts index at 3.7 percent vs 2.6 percent in March 2024 together with Vegetable, tubers, plantains, cooking bananas and pulses, at 1.5 percent vs -6.4 percent. Milk, and Other Dairy Products and Eggs, at 2.1 percent during the reference period from 1.6 percent in the past month. Fish and Other Seafoods at -3.1 percent vs -3.8 percent in the previous period. These are some of the food items that significantly influenced the increase of Food commodity group sector during the reference period. (Table 7)
In the meantime, the following food groups exhibited an annual changes or retain its previous mark during the period:
Sugar, Confectionery & Dessert -3.7 percent vs -2.8 percent in February 2024
Oil and Fats, 0.5 percent vs 0.8 percent in February 2024
Flour, Bread and Other Bakery Products, Pasta products and other Cereals, 2.6 percent vs 3.0 percent
Meat and Other Parts of Slaughtered Land Animals, 21.7 percent vs 20.9 percent.
Ready-made Food and Other Food Products NEC, 3.5 percent vs 4.4 percent
Corn, 4.1 percent vs 4.1 percent
Moreover, the annual rate of Non-alcoholic beverages noticed a surge at 1.1 percent vs 0.6 percent in its previous period. In contrast Alcoholic Beverages and Tobacco which continued to plunge at 2.9 percent vs 3.1, percent in March 2024. (Table 9)
Attachment