

Release Date :
Reference Number :
2024 – 013
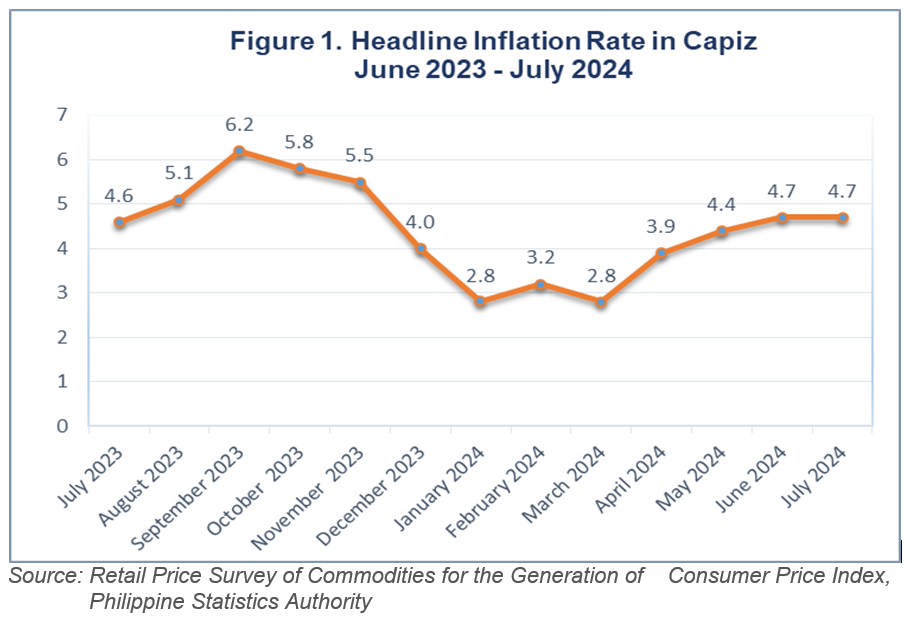
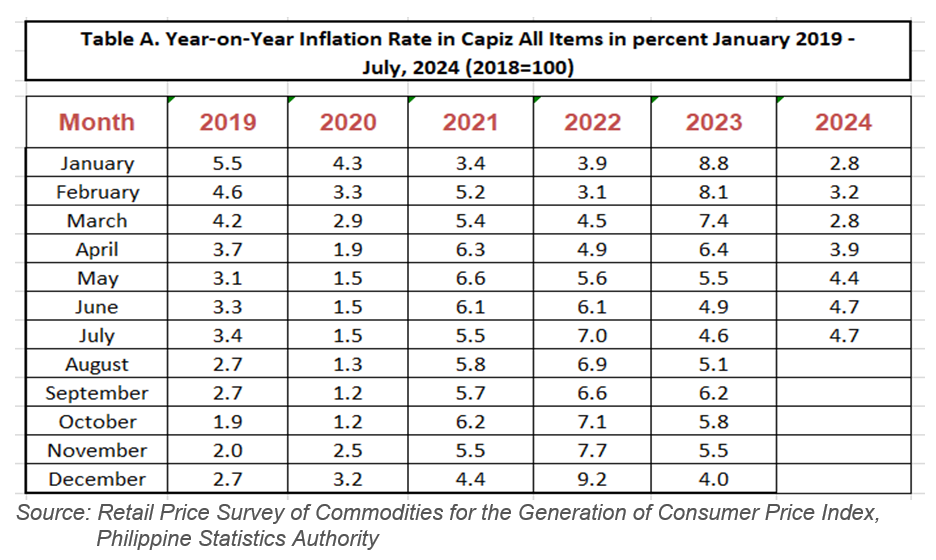
The headline inflation in the province of Capiz remained at 4.7 percent in July 2024, the same as recorded in June 2024. This marks the highest recorded inflation so far for the year 2024, but still the seventh lowest in the last twenty-four months since the base year was changed to 2018. Inflation in June 2023 was slightly lower at 4.6 percent. The average inflation for the year stood at 3.8 percent (Figure 1 and Table A).
The main cause of the provincial inflation maintaining its level despite the decrease in the index of the most heavily weighted commodity group, Food and Non-Alcoholic Beverages, was a drop to 7.5 percent from 7.7 percent in June 2024. This decrease was offset by the Non-Food commodity group, which increased to 2.2 percent from 2.0 percent in June 2024. The surge was led by Education, which rose to 6.8 percent from 2.7 percent in the previous month.
During the period, the Non-Food Commodity group saw increases in various categories. Transport increased by 0.7 percent compared to -0.6 percent in June 2024. Recreation, Sport, and Culture rose by 3.3 percent, up from 1.5 percent, while Personal Care and Miscellaneous Goods increased to 2.1 percent from the previous month's 1.7 percent (Table 4).
Meanwhile, there was an annual inflation drop in the Housing, Water, Electricity, Gas and other fuels category, which decreased from 3.8 percent in June 2024 to 3.0 percent. Specifically, the annual rate of Electricity, Gas and other fuels dropped from 7.4 percent to 5.5 percent compared to the previous period. Other commodities in this group either maintained their previous rates or had a negligible annual change.
The overall food index decelerated to 8.0 percent in July 2024 from 8.3 percent in the previous month. In July 2023, the food index was even higher at 8.7 percent. The significant decline in the heavily weighted commodity of Cereals at 21.7 percent, compared to 23.2 percent in June 2024, and Fish and other Seafoods at -2.4 percent, compared to -1.4 percent in the previous month, were the leading factors influencing the decrease in the Food commodity group sector during the reference period.
Furthermore, some food commodity items showed a significant increase in the annual rate. Ready-made Food and Other Food Products NEC index increased to 8.4 percent from 8.0 percent in June 2024, while Vegetable, tubers, plantains, cooking bananas, and pulses increased to 2.4 percent from 1.9 percent in the previous period (Table 7).
During the same period, the following food groups either exhibited an annual change or retained their previous marks.
1. Sugar, Confectionery & Dessert -3.9 percent vs -3.7 percent in June 2024
2. Milk and Other Dairy products & Egg , 2.2 percent vs 2.2 percent in June 2024 3. Flour, Bread and Other Bakery Products, Pasta products and other Cereals, 2.0 percent vs 2.1 percent
4. Meat and Other Parts of Slaughtered Land Animals, 20.5 percent vs 19.8 percent.
5. Oil and Fats, 1.4 percent vs 1.3 percent
6. Corn, 4.1 percent vs 4.9 percent
The annual rate of non-alcoholic beverages remains unchanged at 0.7 percent, just like in the previous period. Similarly, alcoholic beverages and tobacco also maintained their previous rate at 2.4 percent, the same as in June 2024 (Table 9).
Attachment