

Release Date :
Reference Number :
SR-2025-0604-12
I. Year-on-Year Inflation
In April 2025, the headline inflation rate in Aklan further eased to -1.2 percent, marking the lowest level recorded since January 2019. Negative inflation in April 2025 indicates that average prices of goods and services were lower compared to April 2024. This is a notable decline from the 0.4 percent rate registered in March 2025 and is 6.1 percentage points lower than the 4.9 percent inflation recorded in April 2024. On average, prices of goods and services in the province increased at a slower pace compared to the national and regional inflation rates, which stood at 1.4 percent and 1.9 percent, respectively.
Table 1. Year-on-Year Inflation Rates, All Items
In percent
(2018=100)
Area | April 2024 | March 2025 | April 2025 |
Philippines | 3.8 | 1.8 | 1.4 |
Western Visayas | 4.1 | 2.7 | 1.9 |
Aklan | 4.9 | 0.4 | -1.2 |
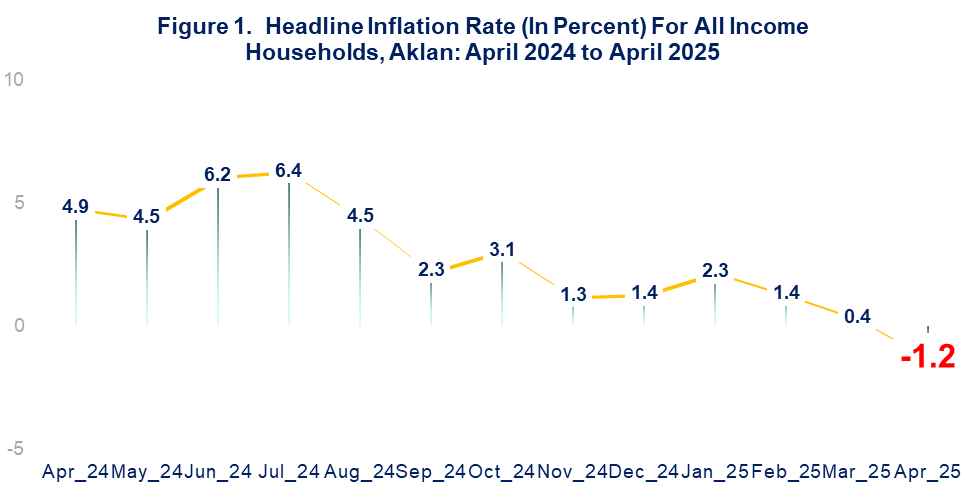
Table 2. Year-on-Year Inflation Rates by Month: Aklan, January 2019 to April 2025
Month/Year | 2019 | 2020 | 2021 | 2022 | 2023 | 2024 | 2025 |
January | 2.1 | 5.8 | 2.5 | 2.0 | 7.9 | 3.0 | 2.3 |
February | 1.6 | 5.9 | 2.5 | 1.3 | 8.1 | 3.5 | 1.4 |
March | 0.6 | 5.4 | 3.2 | 2.8 | 6.9 | 3.8 | 0.4 |
April | -0.1 | 5.2 | 2.8 | 3.2 | 6.8 | 4.9 | -1.2 |
May | 0.8 | 5.0 | 2.4 | 4.1 | 6.2 | 4.5 | |
June | 2.2 | 3.9 | 1.7 | 4.8 | 5.3 | 6.2 | |
July | 3.0 | 2.9 | 1.9 | 5.8 | 3.5 | 6.4 | |
August | 1.7 | 2.4 | 2.1 | 6.3 | 4.5 | 4.5 | |
September | 1.1 | 2.1 | 2.3 | 6.7 | 5.6 | 2.3 | |
October | 0.8 | 2.6 | 2.0 | 7.7 | 4.0 | 3.1 | |
November | 2.9 | 3.6 | 2.1 | 7.5 | 4.0 | 1.3 | |
December | 4.0 | 3.9 | 1.7 | 7.7 | 3.9 | 1.4 |
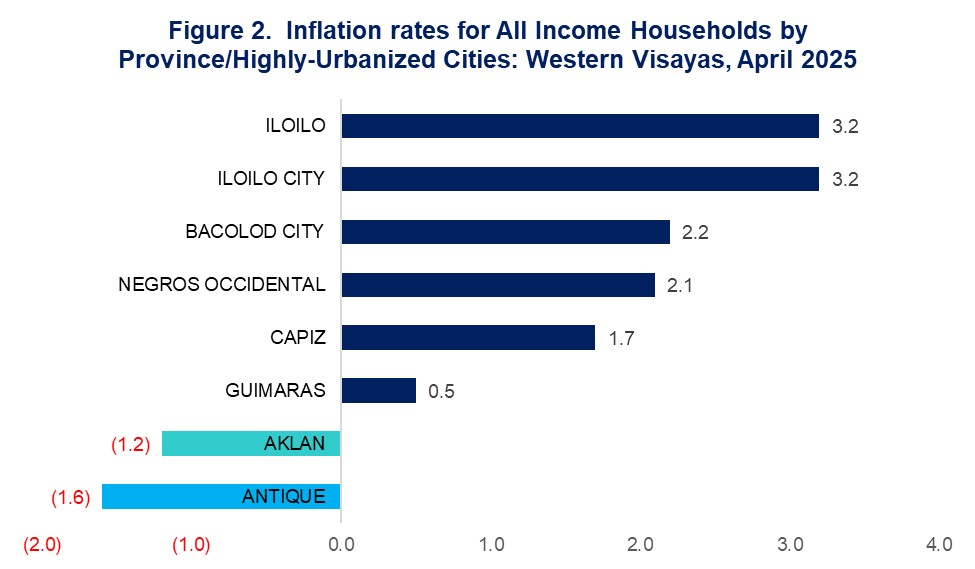
Among provinces and highly-urbanized cities in Western Visayas, Aklan posted 2nd lowest inflation rate next to Antique with -1.6 percent inflation. This further implies that living costs in Aklan were rising slower than other provinces and highly-urbanized cities in April 2025.
Top contributors to downtrend of inflation
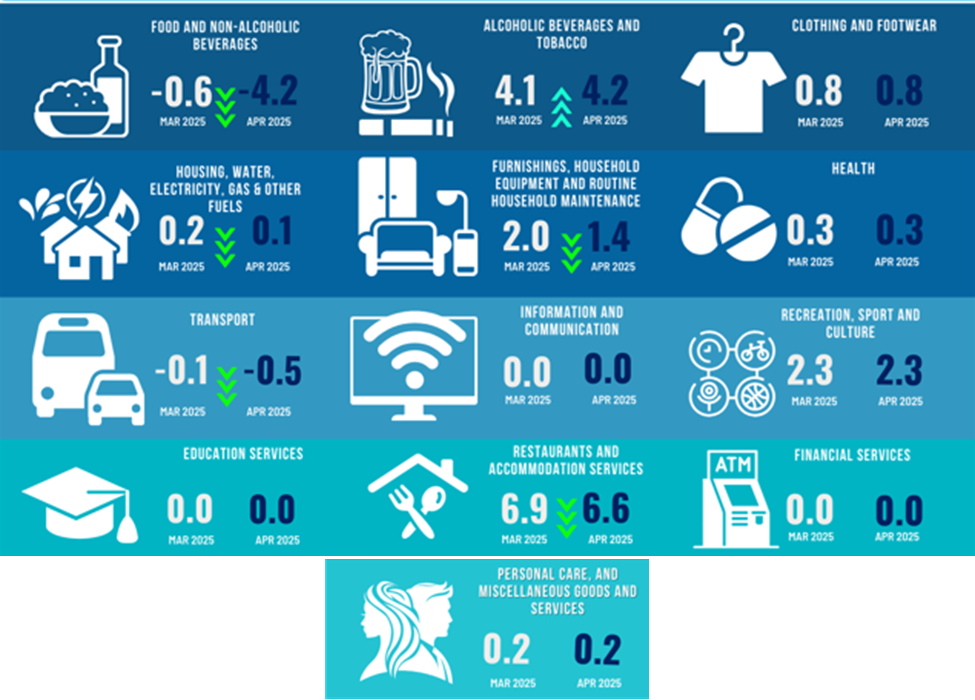
Five (5) major commodity groups exhibited slower inflation rates, one showed faster increase while seven (7) showed constant movement of prices from March to April 2025. Food and Non-Alcoholic Beverages contributed the highest in the inflation downtrend this month, having 93.9 percent share to inflation downtrend. It registered an inflation of -4.2 percent in April 2025 from -0.6 percent inflation in the previous month. (See Figure 3)
Transport, distantly followed, that displayed a deceleration in inflation from -0.1 percent in the previous month to -0.5 percent in April 2025, while, Furnishings, Household Equipment and Routine Household Maintenance declined from 2.0 percent a month ago to 1.4 percent inflation reported this month. Also, Housing, Water, Electricity, Gas and Other Fuels declined from 0.2 percent to 0.1 percent inflation, and Restaurants and Accommodation Services dropped from 6.9 percent to 6.6 percent inflation in a month. (See Figure 3)
Other major commodities that showed stable inflation rate from March to April 2025 were:
a. Clothing and Footwear, with 0.8 percent inflation;
b. Health, with 0.3 percent inflation;
c. Recreation, sport and culture, with 2.3 percent inflation; and
d. Personal care, and miscellaneous goods and services, with 0.2 percent inflation. (See Figure 3).
Meanwhile, Information and Communication, Financial Services and Education Services recorded stable yet zero percent inflation from March and April 2025: Zero percent inflation implies that these commodities have shown no price changes compared to 2024. (See Figure 3)
On the contrary, Alcoholic Beverages and Tobacco showed faster price movement this month with 4.2 percent than 4.1 percent inflation last month.
Figure 3. Inflation rates for All Income Households by Major Commodities: Aklan, March to April 2025
Major Contributors to Inflation
Generally, inflation means that prices of goods and services increase over time. In April 2025, prices of goods and services still went up, however, at a slower rate.
The overall inflation of Aklan was majorly contributed by price hike of Food and non-alcoholic beverages which recorded -4.2 percent inflation with 157.5 percent share to overall inflation. This was followed by Transport with -0.5 percent inflation and 3.9 percent share to inflation. (See Table 3)
Table 3. Year-on-Year Inflation rates, for All Income Households, by Major Commodity Groups: Aklan, April 2024, March 2025 and April 2025
Commodity Groups | Inflation rates (for All Income Households) | % Contribution to Overall Inflation for All Items | ||||
Apr '24 | Mar '25 | Apr '25 | % | Point | Rank | |
ALL ITEMS | 4.9 | 0.4 | -1.2 | 100 | -1.2 | |
FOOD AND NON-ALCOHOLIC BEVERAGES | 10.1 | -0.6 | -4.2 | 154.7 | (1.86) | 1 |
ALCOHOLIC BEVERAGES AND TOBACCO | 4.7 | 4.1 | 4.2 | (14.0) | 0.17 | 12 |
CLOTHING AND FOOTWEAR | 0.2 | 0.8 | 0.8 | (2.3) | 0.03 | 9 |
HOUSING, WATER, ELECTRICITY, GAS AND OTHER FUELS | -0.6 | 0.2 | 0.1 | (1.3) | 0.02 | 8 |
FURNISHINGS, HOUSEHOLD EQUIPMENT AND ROUTINE HOUSEHOLD MAINTENANCE | 0.4 | 2 | 1.4 | (4.3) | 0.05 | 11 |
HEALTH | 1.7 | 0.3 | 0.3 | (0.9) | 0.01 | 7 |
TRANSPORT | 0.1 | -0.1 | -0.5 | 3.9 | (0.05) | 2 |
INFORMATION AND COMMUNICATION | 0 | 0 | 0 | - | - | 3 |
RECREATION, SPORT AND CULTURE | 4.4 | 2.3 | 2.3 | (2.5) | 0.03 | 10 |
EDUCATION SERVICES | -2 | 0 | 0 | - | - | 3 |
RESTAURANTS AND ACCOMMODATION SERVICES | 7.1 | 6.9 | 6.6 | (32.6) | 0.39 | 13 |
FINANCIAL SERVICES | -0.1 | 0 | 0 | - | - | 3 |
PERSONAL CARE, AND MISCELLANEOUS GOODS AND SERVICES | 4.1 | 0.2 | 0.2 | (0.6) | 0.01 | 6 |
II. Month-on-Month Inflation
The month-on-month inflation for all items in the province of Aklan pegged at -0.7 percent in April 2025. This indicates that prices of goods and services in Aklan dropped by -0.7 percent compared to March 2025.
Housing, water, electricity, gas, and other fuels primarily contributed to this downtrend having -0.1 percent month-on-month inflation compared to 0.5 percent inflation in March 2025.
Transport, followed, with -0.5 percent month-on-month inflation in April 2025 from 0.6 percent in March 2025, and Alcoholic beverages and tobacco with 0.1 percent month-on-month inflation from 2.6 percent last month.
Also, Furnishings, household equipment and routine household maintenance, Health, and Personal care, and miscellaneous goods and services showed slower inflation compared last month.
Meanwhile, no price movements from last month were recorded for the following major commodities:
a. Clothing and footwear
b. Information and communication
c. Recreation, sport and culture
d. Education services
e. Restaurants and accommodation services
f. Financial services
Table 4. Month-on-Month Inflation rates, for All Income Households, by Major Commodity Groups: Aklan, April 2024, March 2025 and April 2025
Commodity Groups | Mon-on-Month Inflation rates (for All Income Households) | ||
|---|---|---|---|
Apr '24 | Mar '25 | Apr '25 | |
ALL ITEMS | 0.9 | -0.6 | -0.7 |
FOOD AND NON-ALCOHOLIC BEVERAGES | 2.1 | -1.9 | -1.6 |
ALCOHOLIC BEVERAGES AND TOBACCO | -0.1 | 2.6 | 0.1 |
CLOTHING AND FOOTWEAR | 0 | 0 | 0 |
HOUSING, WATER, ELECTRICITY, GAS AND OTHER FUELS | 0 | 0.5 | -0.1 |
FURNISHINGS, HOUSEHOLD EQUIPMENT AND ROUTINE HOUSEHOLD MAINTENANCE | 0.6 | 0.1 | 0 |
HEALTH | 0 | 0.1 | 0 |
TRANSPORT | -0.1 | 0.6 | -0.5 |
INFORMATION AND COMMUNICATION | 0 | 0 | 0 |
RECREATION, SPORT AND CULTURE | 0 | 0 | 0 |
EDUCATION SERVICES | 0 | 0 | 0 |
RESTAURANTS AND ACCOMMODATION SERVICES | 0.3 | 0 | 0 |
FINANCIAL SERVICES | 0 | 0 | 0 |
PERSONAL CARE, AND MISCELLANEOUS GOODS AND SERVICES | 0 | 0.3 | 0 |
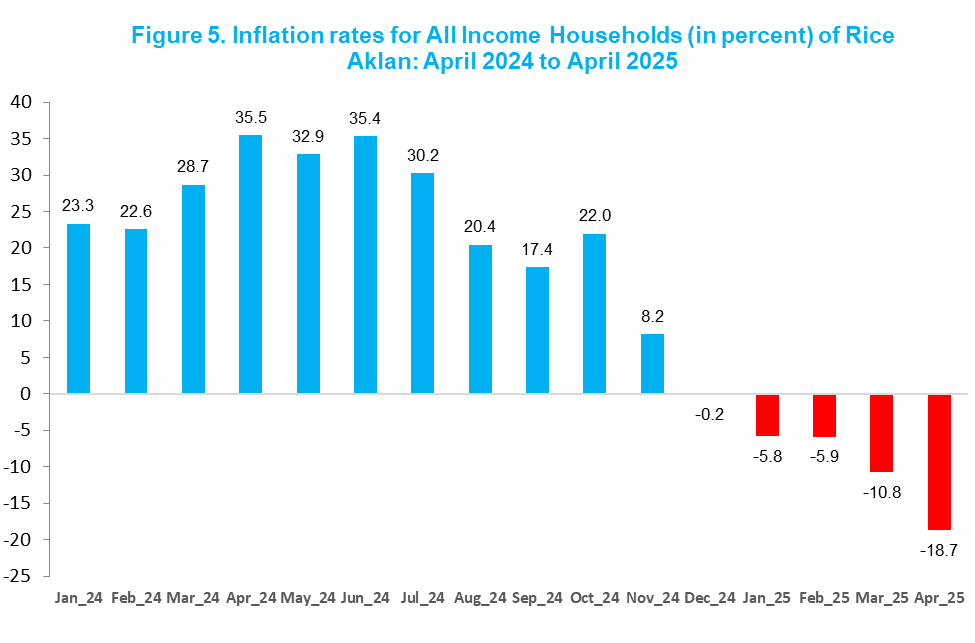
III. Food Inflation
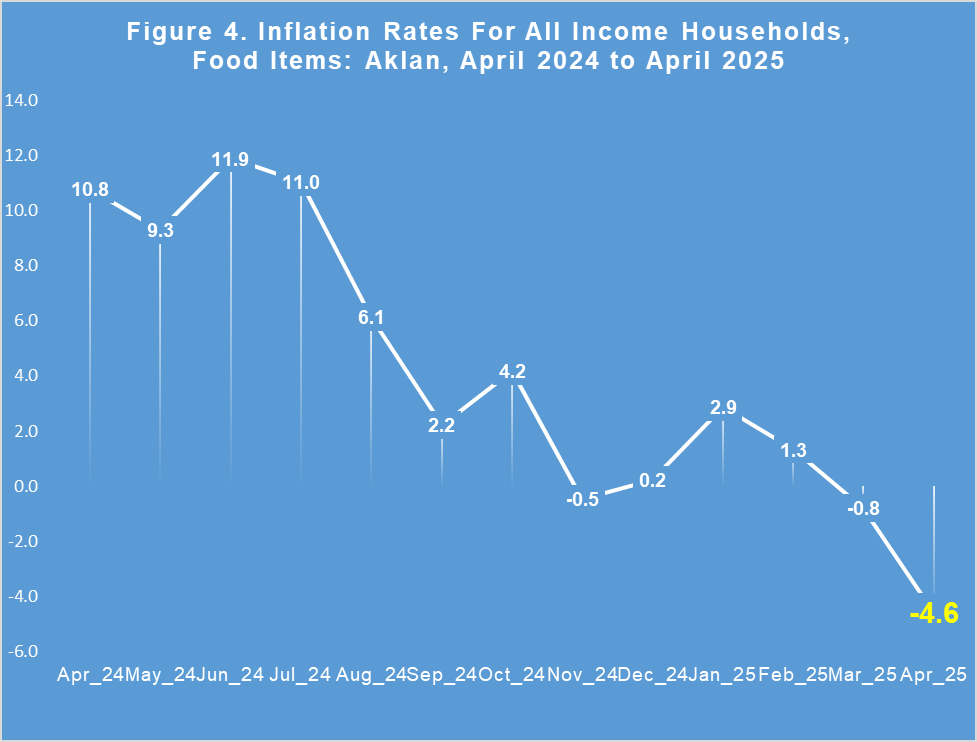
In the province of Aklan, food posted -4.6 percent inflation in April 2025. It significantly slowed down compared to 10.8 percent inflation in April 2024. Food inflation was recorded at -0.8 percent in March 2025.
Aklan had the lowest food inflation among the provinces and highly urbanized cities in Western Visayas in April 2025. It also showed slower inflation rate compared to the national and regional food inflation of 0.4 percent and 0.8 percent, respectively.
The negative food inflation indicates that prices of food commodities, on the average, went down in April 2025 compared to last year and further implies that food were more affordable this month than a year ago.
Major contributors to downtrend of food inflation
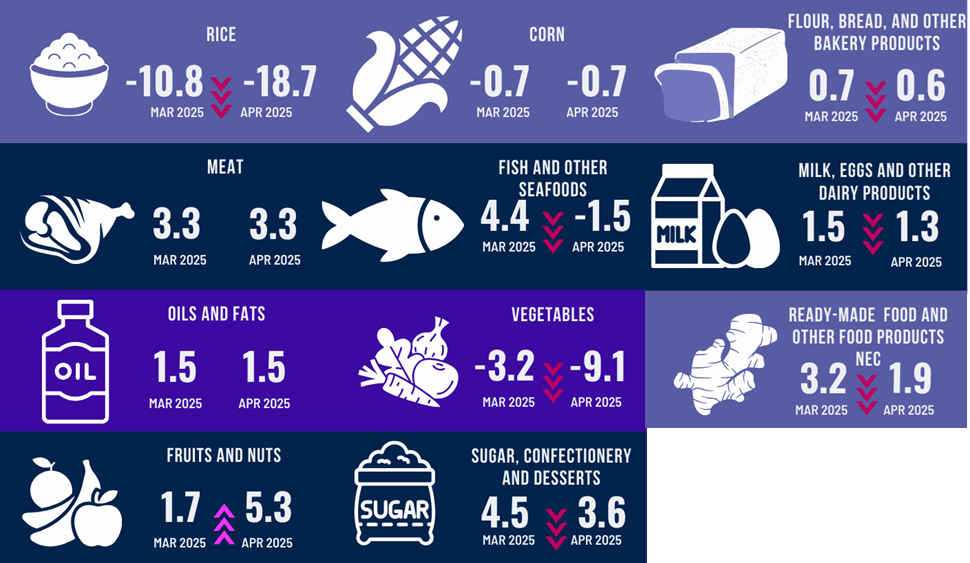
Among the eleven food commodities, rice was the main contributor to the downtrend in food inflation, posting a deflation of -18.7 percent in April 2025, a sharp decline from -10.8 percent in March 2025. Notably, rice has been exhibiting negative inflation since December 2024, indicating that rice prices have been significantly lower compared to the same period in the previous year. (See Figure 5)
Fish and other seafoods, followed next, from 4.4 percent to -1.5 percent inflation in April 2025, as well as, Vegetables, tubers, plantains, cooking bananas and pulses which further declined from -3.2 percent to -9.1 percent from March to April 2025. (See Figure 6)
The following also exhibited slower inflation rates from March to April 2025:
a. Ready-made food and other food commodities, from 3.2 percent to 1.9 percent;
b. Sugar, confectionery and desserts, 4.5 percent to 3.6 percent;
c. Milk, other dairy products and eggs, 1.5 percent to 1.3 percent; and
d. Flour, Bread and Other Bakery Products, Pasta Products, and Other Cereals, from 0.7 percent to 0.6 percent. (See Figure 6)
On the contrary, only Fruits and Vegetables showed faster inflation this month with 5.3 percent inflation from 1.7 percent inflation last month.
Meanwhile, the following food commodities recorded no price movement from March to April 2025:
a. Corn, at -0.7 percent inflation;
b. Meat and other parts of slaughtered land animals, at 3.3 percent inflation; and
c. Oils and fats, at 1.5 percent inflation. (See Figure 6)
Figure 6. Inflation by Food Commodities: Aklan, March 2025 and April 2025
Major Contributors to Food Inflation
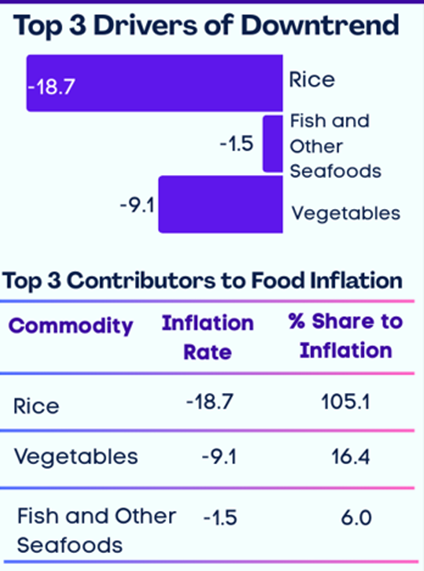
Food inflation in April 2025 was mainly caused by price movement of Rice, that recorded -18.7 percent inflation and contributed 157.5 percent to the total food inflation. Also, prices of Vegetables, tubers, plantains, cooking bananas and pulses contributed highly to the food inflation, with -9.1 percent inflation which accounted to 16.4 percent share to food inflation. And Fish and other seafoods that recorded -1.5 percent inflation accounted for 6.0 percent contribution to food inflation.
Purchasing Power of Peso

The purchasing power of peso (PPP) is inversely associated with inflation, which implies that as inflation increases, the purchasing power of peso decreases and vice versa.
The Purchasing Power of the Peso (PPP) in April 2025 stood at 81 centavos, slightly higher than the 80 centavos recorded in April 2024, but remained unchanged compared to PPP in the previous month.
The PPP tells that in April 2025, prices of goods and services in Aklan are 81% less affordable than in 2018 due to inflation. On the average, Aklanons need P1,233.00 to buy the same set of goods and services that cost P1,000.00 in 2018.
Nonetheless, prices of goods and services in April 2025 became more affordable compared to their prices in April 2024. A 1000-peso set of goods and services in April 2024 only cost P987.98 or P12.02 less in April 2025.
Meanwhile, food became more affordable for Aklanons in April 2025 compared to the same month last year. A household that spent ₱1,000 on food in April 2024 spent ₱953.99 in April 2025—₱46.01 less. In particular, rice prices showed significant deflation: rice that cost ₱50 per kilo in April 2024 averaged only to ₱44.71 per kilo in April 2025.
Table 5. Consumer Price Index by Subgroup, Month-on-Month and Year-on-Year Percent Changes in Aklan (2018=100)
| Commodity Group | CPI | Inflation Rates | |||
| Apr-24 | Mar-25 | Apr-25 | Month-on-Month | Year-on-Year | |
| ALL ITEMS | 124.8 | 124.2 | 123.3 | -0.7 | -1.2 |
| I. FOOD AND NON-ALCOHOLIC BEVERAGES | 129.3 | 125.9 | 123.9 | -1.6 | -4.2 |
| * Food | 130.4 | 126.6 | 124.4 | -1.7 | -4.6 |
| Cereals and Cereal Products | 118.4 | 101.8 | 100.8 | -1 | -14.9 |
| Cereals | 117.4 | 96.8 | 95.6 | -1.2 | -18.6 |
| Rice | 117.4 | 96.6 | 95.4 | -1.3 | -18.7 |
| Corn | 124.7 | 123.8 | 123.8 | 0 | -0.7 |
| Flour, Bread and Other Bakery Products, Pasta Products, and Other Cereals | 122.6 | 123.3 | 123.3 | 0 | 0.6 |
| Meat and Other Parts of Slaughtered Land Animals | 159.1 | 162.7 | 164.3 | 1 | 3.3 |
| Fish and Other Seafood | 125.8 | 131.4 | 123.9 | -5.7 | -1.5 |
| Milk, Other Dairy Products, and Eggs | 130.3 | 132 | 132 | 0 | 1.3 |
| Oils and Fats | 135.6 | 137.6 | 137.6 | 0 | 1.5 |
| Fruits and Nuts | 137.1 | 142.8 | 144.3 | 1.1 | 5.3 |
| Vegetables, Tubers, Cooking Bananas and Pulses | 130.7 | 128.6 | 118.8 | -7.6 | -9.1 |
| Sugar, Confectionery and Desserts | 134.6 | 139.3 | 139.5 | 0.1 | 3.6 |
| Ready-Made Food and Other Food Products N.E.C. | 124.8 | 125.9 | 127.2 | 1 | 1.9 |
| * Non-alcoholic Beverages | 113.5 | 116 | 115.9 | -0.1 | 2.1 |
| II. ALCOHOLIC BEVERAGES AND TOBACCO | 174.9 | 182.2 | 182.3 | 0.1 | 4.2 |
| Alcoholic Beverages | 128.7 | 131.1 | 131.1 | 0 | 1.9 |
| Tobacco | 228.5 | 241.4 | 241.5 | 0 | 5.7 |
| Other Vegetable-Based Tobacco Products | |||||
| NON-FOOD | 119 | 120.2 | 120.1 | -0.1 | 0.9 |
| III. CLOTHING AND FOOTWEAR | 106.5 | 107.4 | 107.4 | 0 | 0.8 |
| Clothing | 107.1 | 107.8 | 107.9 | 0.1 | 0.7 |
| Footwear | 105.1 | 106.4 | 106.3 | -0.1 | 1.1 |
| IV. HOUSING, WATER, ELECTRICITY, GAS AND OTHER FUELS | 123.6 | 123.8 | 123.7 | -0.1 | 0.1 |
| Actual Rentals for Housing | 126.6 | 126.6 | 126.6 | 0 | 0 |
| Maintenance, Repair and Security of the Dwelling | 108.3 | 116.3 | 116.3 | 0 | 7.4 |
| Water Supply and Miscellaneous Services Relating to the Dweling | 97.7 | 97.7 | 97.7 | 0 | 0 |
| Electricity, Gas and Other Fuels | 122.9 | 122.7 | 122.5 | -0.2 | -0.3 |
| V. FURNISHINGS, HOUSEHOLD EQUIPMENT AND ROUTINE HOUSEHOLD MAINTENANCE | 125.1 | 126.8 | 126.8 | 0 | 1.4 |
| Furniture and Furnishings, and Loose Carpets | 110.9 | 112.9 | 112.9 | 0 | 1.8 |
| Household Textiles | 104 | 104 | 104 | 0 | 0 |
| Household Appliances | 107.3 | 107.4 | 107.4 | 0 | 0.1 |
| Glassware, Tableware and Household Utensils | 107.4 | 107.4 | 107.4 | 0 | 0 |
| Tools and Equipment for House and Garden | 111.6 | 112 | 112 | 0 | 0.4 |
| Goods and Services for Routine Household Maintenance | 132.9 | 135 | 135 | 0 | 1.6 |
| VI. HEALTH | 116.9 | 117.2 | 117.2 | 0 | 0.3 |
| Medicines and Health Products | 118.6 | 119 | 119 | 0 | 0.3 |
| Outpatient Care Services | 122.5 | 122.5 | 122.5 | 0 | 0 |
| Inpatient Care Services | 110.3 | 110.3 | 110.3 | 0 | 0 |
| Other Health Services | 120.6 | 121.7 | 121.7 | 0 | 0.9 |
| VII. TRANSPORT | 123.8 | 123.8 | 123.2 | -0.5 | -0.5 |
| Purchase of Vehicles | 102.8 | 109.4 | 109.4 | 0 | 6.4 |
| Operation of Personal Transport Equipment | 118.2 | 110.7 | 106 | -4.2 | -10.3 |
| Passenger Transport Services | 144.5 | 144.6 | 146.5 | 1.3 | 1.4 |
| Transport Services of Goods | 107.8 | 107.8 | 107.8 | 0 | 0 |
| VIII. INFORMATION AND COMMUNICATION | 103.1 | 103.1 | 103.1 | 0 | 0 |
| Information and Communication Equipment | 104.6 | 104.6 | 104.6 | 0 | 0 |
| Information and Communication Services | 102.2 | 102.2 | 102.2 | 0 | 0 |
| IX. RECREATION, SPORT AND CULTURE | 112.5 | 115.1 | 115.1 | 0 | 2.3 |
| Recreational Durables | 100 | 100 | 100 | 0 | 0 |
| Other Recreational Goods | 106.8 | 106.8 | 106.8 | 0 | 0 |
| Garden Products and Pets | 117.4 | 115.9 | 115.9 | 0 | -1.3 |
| Recreational Services | 92.3 | 92.3 | 92.3 | 0 | 0 |
| Cultural Goods | 100.3 | 100.3 | 100.3 | 0 | 0 |
| Cultural Services | 103 | 111 | 111 | 0 | 7.8 |
| Newspapers, Books and Stationery | 132.6 | 134.1 | 134.1 | 0 | 1.1 |
| Package Holidays | |||||
| X. EDUCATION SERVICES | 114.2 | 114.2 | 114.2 | 0 | 0 |
| Early Childhood and Primary Education | 136 | 136 | 136 | 0 | 0 |
| Secondary Education | 106.1 | 106.1 | 106.1 | 0 | 0 |
| Tertiary Education | 107.8 | 107.8 | 107.8 | 0 | 0 |
| Education Not Defined by Level | |||||
| XI. RESTAURANTS AND ACCOMMODATION SERVICES | 118.1 | 125.9 | 125.9 | 0 | 6.6 |
| Food and Beverage Serving Services | 119.9 | 128.4 | 128.4 | 0 | 7.1 |
| Accommodation Services | 100 | 100 | 100 | 0 | 0 |
| XII. FINANCIAL SERVICES | 145.3 | 145.3 | 145.3 | 0 | 0 |
| Financial Services | 145.3 | 145.3 | 145.3 | 0 | 0 |
| XIII. PERSONAL CARE, AND MISCELLANEOUS GOODS AND SERVICES | 111 | 111.2 | 111.2 | 0 | 0.2 |
| Personal Care | 111.8 | 112.5 | 112.5 | 0 | 0.6 |
| Other Personal Effects | 107.6 | 105.7 | 105.7 | 0 | -1.8 |
| Other Services | 100.4 | 100.4 | 100.4 | 0 | 0 |
Source: Philippine Statistics Authority, Retail Price Survey on the Generation of Consumer Price Index
EXPLANATORY TEXT
Consumer Price Index (CPI) - is an indicator of the change in the average retail prices of a fixed basket of goods and services commonly purchased by the households relative to a base year. It shows how much on the average, prices of goods and services have increased or decreased from a particular reference period.
The CPI Report was derived from the results of the 2018-based CPI survey comprised of thirteen (13) major commodity groups. These are the following: Food and Non-alcoholic Beverages; Alcoholic Beverages and Tobacco; Clothing and Footwear; Housing, Water, Electricity, Gas and Other Fuels; Furnishings, Household Equipment and Routine Maintenance of the House; Health; Transport; Information and Communication Services; Recreation, Sport and Culture; Education; Restaurants and Accommodation Services; Financial Services; and Personal Care and Miscellaneous Goods and Services.
Inflation rate is defined as the annual rate of change or the year-on-year change in the CPI.
Purchasing power of peso is a measure of the real value of the peso in a given period relative to a chosen reference period.
Market basket is a term used to refer to a sample of goods and services that are commonly purchased and bought by an average Filipino household.
Base period or Base Year is the period, usually a year, at which the index number is set to 100. It is the reference point of the index number series. In this report, 2018 is used as the base period.
ENGR. ANTONET B. CATUBUAN
Chief Statistical Specialist
Attachment