

Release Date :
Reference Number :
25PSA-0679-SR32
The municipality of Buenavista had a total population of 52,899 people based on the 2020 Census of Population and Housing (2020 CPH), larger by 2,507 persons compared to its 50,392 population in 2015.
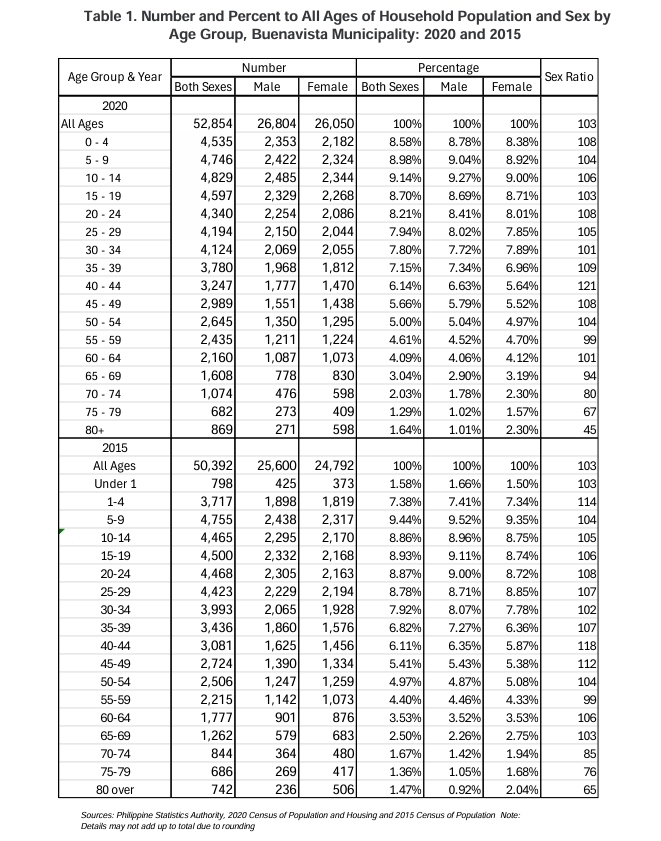
The household population of Buenavista reached 52,854 persons, 26,804 (50.71%) were males while 26,050 (49.29%) were females. By age group, 14,110 (26.70%) were under 15 years of age (young dependents), while those in age groups 65 years and over (old dependents) comprised the remaining 4,233 (8.01%). The percentage of young dependents was lower when compared to 2015 with 27.26% while the old dependents was higher in 2020 by 1.0 percentage point.
On the other hand, there was a slight increment in the percentage of people aged 15 to 64 years (working age or economically active population) in 2020 totaled at 34,511 (65.30%) from the 33,123 (65.73%) in 2015
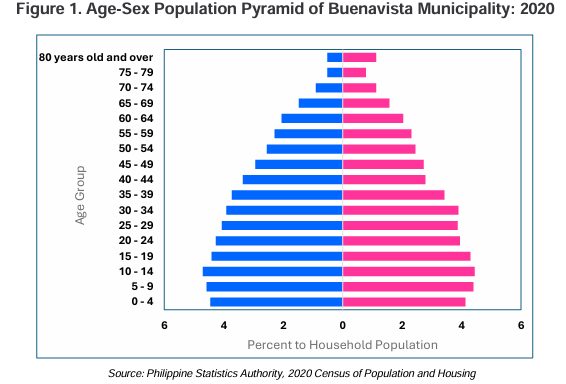
Moreover, there were more males (45.25%) than females (42.65%) among the 0 to 59 age group. However, among the older age group (60 years and over), females (6.64%) outnumbered the males (5.46%). The same trend was also observed in 2015.
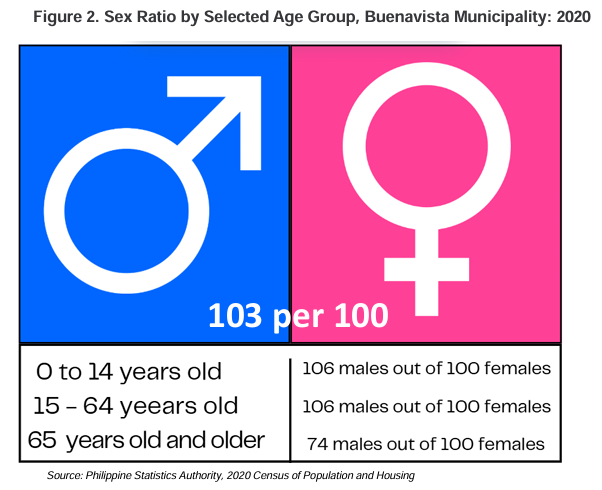
Sex ratio stands at 103 males per 100 females
The sex ratio of male over female households’ population in Buenavista Municipality was computed at 103 in 2020. This means that there were 103 males for every 100 females, lower than the sex ratio in 2015 at 106 males per 100 females.
In 2020, children aged below 15 years had a sex ratio of 106 males per 100 females. Similarly, those aged 15 to 64 years had a sex ratio of 106 males per 100 females. Moreover, among those aged 65 years and over, the sex ratio was at 74 males per 100 females. This depicts a longer life expectancy among females than males or a higher mortality rate among males than females in the older age groups.
There were more males than female children under five years old
The sex ratio for children under five years old in 2020 was 108 males per 100 females, higher than the 2015 ratio of 106 males per 100 females. Additionally, children under five comprised 8.6 percent (4,535 persons) of the household population in 2020, a decrease from 8.96 percent (4,515 persons) in 2015.
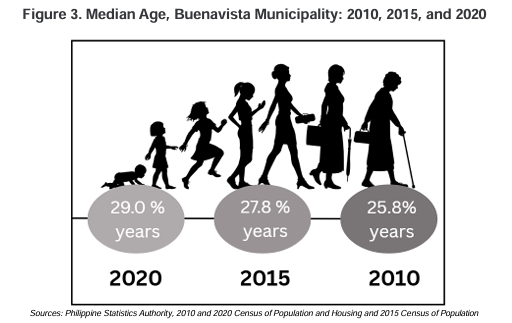
Median age measures at 29 years
The median age of household population in Buenavista Municipality continues to increase during the past three censuses. In 2020, the median age was computed at 29 years, which means that half of the household population was younger than 29.0 years, while the other half is older than 29 years. This is higher than the median ages of 27.8 and 25.8 years posted in 2015 and 2010, respectively.
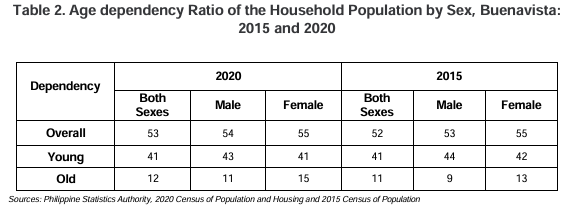
Dependency ratio increases to 53 dependents per 100 persons in the working- age group
The 2020 overall dependency ratio of Buenavista Municipality was computed at 53, which indicates that for every 100 working-age or economically active population, there were about 53 dependents (41 young dependents and 12 old dependents). This is higher than the dependency ratio in 2015 at 52 dependents per 100 working-age population (41 young dependents and 11 old dependents).
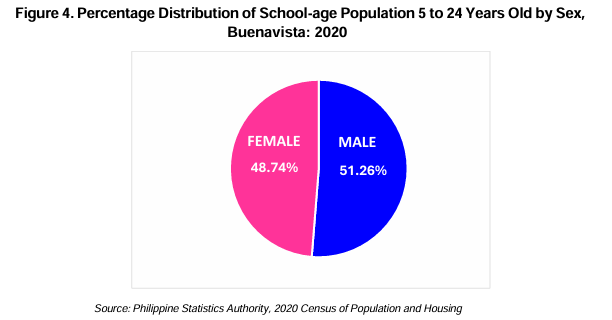
Two in every five households’ population are of school age
In 2020, the school-age population (5 to 24 years old) accounted for 18,512 (35.02%) of the household population which is slightly lower compared to the 18,188 (36.1%) school-age population that was reported in 2015. Moreover, there were more males (51.3%) than females (48.7%) school-age population in 2020.
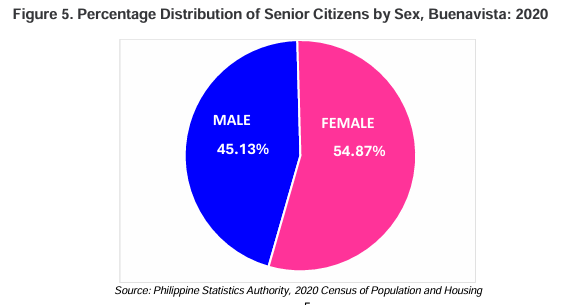
Senior citizens accounts for 12.1 percent of the household population
In Buenavista Municipality people aged 60 years old and over regarded as senior citizens, made up 12.1 percent (6,393 persons) of the household population in 2020, higher than the 10.5 percent (5,311 persons) recorded in 2015.
There were more females (54.87%) than males (45.13%) among the senior citizens in 2020. The same trend was observed in 2015.
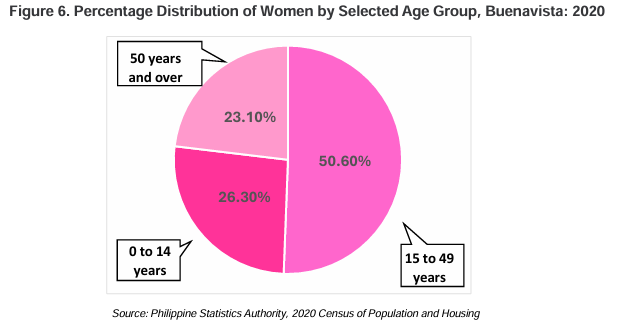
Half of the female population are of reproductive age
Women of reproductive age (15 to 49 years old) totaled at 13,173 or 50.6 percent of the 26,050 female household population in 2020. This percentage was lower compared to the 51.7 percent or 12,819 females posted in 2015.
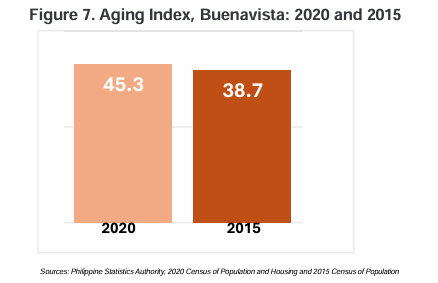
Aging index is higher by 6.6 percentage points from 38.7 in 2015 to 45.3 in 2020
In Buenavista Municipality, the aging index or the proportion of people aged 60 years and over, in every 100 persons under the age of 15 years was computed at 45.3 percent in 2020. This means that there are about 45 persons aged 60 years and over for every 100 children under 15 years old. The aging index was lower in 2015 at 38.7 percent.
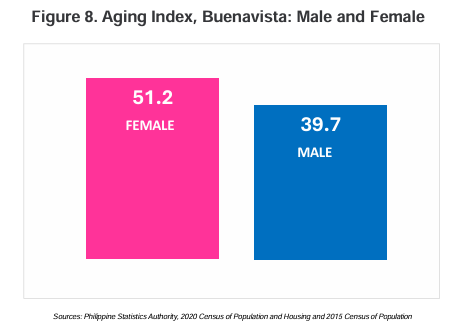
Aging index of men is less than women in 2020
In Buenavista Municipality, the aging index of men and women is the proportion of men and women aged 60 years and over per 100 men or women aged under 15 years old. The aging index of men is 39.7 percent which is 11.5 percent less that the aging index of women which is 51.2 percent. This means that there are fewer elderly men compared to elderly women and can indicate several demographic factors: higher life expectancy for women, higher mortality rates for men, and gender imbalance in elderly.
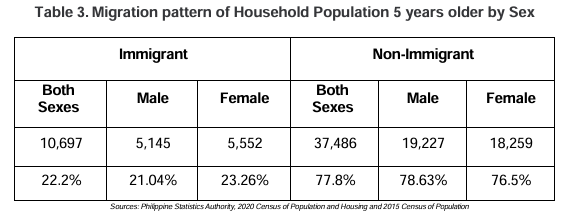
Migration Patterns in Buenavista Municipality
In Buenavista Municipality, migration patterns vary by sex. The data shows that 22.2% of the population are immigrants, meaning they were born in a different province or a foreign country. Among them, 23.26% are females and 21.04% are males. This suggests that women have a slightly higher migration rate than men. On the other hand, 77.8% of the population are non-immigrants, meaning they were born in the same municipality or province. Among them, 78.63% are males and 76.5% are females.
TECHNICAL NOTES
The Philippine Statistics Authority conducted the 2020 Census of Population and Housing (2020 CPH) in September 2020, with 01 May 2020 as reference date.
The 2020 CPH was the 15th census of population and 7th census of housing that was undertaken in the Philippines since the first census in 1903. It was designed to take inventory of the total population and housing units in the country and collect information about their characteristics.
The Philippine Standard Geographic Codes as of April 2022 was used for the disaggregation of geographic levels of the 2020 CPH.
Age refers to the interval of time between the person’s date of birth and his/her last birthday prior to the census reference date. It is expressed in completed years or whole number.
Aging index is calculated as the number of persons 60 years old and over per one hundred persons under the age of 15 years.
Aging of population is a process in which the proportions of adults and elderly increase in a population, while the proportions of children and adolescents decrease. This process results in a rise in the median age of the population. Aging occurs when fertility rates decline while life expectancy remains constant or improves at the older ages.
Household is a social unit consisting of people or a group of persons who sleep in the same housing unit and have a common arrangement in the preparation and consumption of food.
Household population refers to all people who are members of the household.
Median age is the age that divides the population into two numerically equal groups; that is, half of the population are younger than this age and the other half are older.
Overall dependency ratio is the number of persons under 15 years old (young dependents) and persons aged 65 and older (old dependents) per one hundred persons 15 to 64 years old (working-age or economically-productive group) in a population.
Population pyramid is a bar chart, arranged vertically, that shows the distribution of a population by age and sex. By convention, the younger ages are at the bottom, with males on the left and females on the right.
Sex is the biological and physiological reality of being a male or female.
Sex ratio is the number of males per one hundred females in a population.
Attachment